In this PyQtChart article iam going to show you How to Create PieChart in PyQt5. we are going to use PyQtChart library for this article, so PyQtChart is a set of Python bindings for The Qt Company’s Qt Charts library. The bindings sit on top of PyQt5 and are implemented as a single module, The commercial version of PyQtChart is bundled with the commercial version of PyQt. also you can check my first and second article in PyQtChart in the below links.
1: PyQtChart How to Create BarChart in PyQt5
2: PyQtChart How to Create LineChart in PyQt5
Also you can check PyQt5 Complete Tutorials
What are PieCharts ?
A pie chart, as its name implies, is a type of chart that looks like a pie. A pie chart presents
its data in the form of pie slices. The size of each slice of pie will be determined by the
overall percentage of its value compared to the rest of the data. Therefore, pie charts are
normally used to display fraction, ratio, percentage, or a share of a set of data:
So now this is the complete code for PyQtChart How to Create PieChart in PyQt5
|
1 2 3 4 5 6 7 8 9 10 11 12 13 14 15 16 17 18 19 20 21 22 23 24 25 26 27 28 29 30 31 32 33 34 35 36 37 38 39 40 41 42 43 44 45 46 47 48 49 50 51 52 53 54 55 56 57 58 59 60 61 62 63 64 65 66 |
from PyQt5.QtWidgets import QApplication, QMainWindow import sys from PyQt5.QtChart import QChart, QChartView, QPieSeries, QPieSlice from PyQt5.QtGui import QPainter, QPen from PyQt5.QtCore import Qt class Window(QMainWindow): def __init__(self): super().__init__() self.setWindowTitle("PyQtChart Pie Chart") self.setGeometry(100,100, 1280,600) self.show() self.create_piechart() def create_piechart(self): series = QPieSeries() series.append("Python", 80) series.append("C++", 70) series.append("Java", 50) series.append("C#", 40) series.append("PHP", 30) #adding slice slice = QPieSlice() slice = series.slices()[2] slice.setExploded(True) slice.setLabelVisible(True) slice.setPen(QPen(Qt.darkGreen, 2)) slice.setBrush(Qt.green) chart = QChart() chart.legend().hide() chart.addSeries(series) chart.createDefaultAxes() chart.setAnimationOptions(QChart.SeriesAnimations) chart.setTitle("Pie Chart Example") chart.legend().setVisible(True) chart.legend().setAlignment(Qt.AlignBottom) chartview = QChartView(chart) chartview.setRenderHint(QPainter.Antialiasing) self.setCentralWidget(chartview) App = QApplication(sys.argv) window = Window() sys.exit(App.exec_()) |
So in the above code first of all we have imported our required classes form QtChart and PyQt5, QChart and QChartView are both essential for working of Charts in PyQt5, also we have imported QPieSeries and QPieSlice. after that we have created our Window class that extends from QMainWindow, and we have added our window title and window geometry in this class also we have called our create_piechart() method.
|
1 2 3 4 5 6 7 8 9 10 |
class Window(QMainWindow): def __init__(self): super().__init__() self.setWindowTitle("PyQtChart Pie Chart") self.setGeometry(100,100, 1280,600) self.show() self.create_piechart() |
These are the data for our piechart or we can call it PieSeries, basically in pyqt5 it is called PieSeries.
|
1 2 3 4 5 6 |
series = QPieSeries() series.append("Python", 80) series.append("C++", 70) series.append("Java", 50) series.append("C#", 40) series.append("PHP", 30) |
Because we are going to add slice to value of piechart, you need add these codes for adding slice.
|
1 2 3 4 5 6 |
slice = QPieSlice() slice = series.slices()[2] slice.setExploded(True) slice.setLabelVisible(True) slice.setPen(QPen(Qt.darkGreen, 2)) slice.setBrush(Qt.green) |
basically we have created the object of QPieSlice, and we want the slice should be in our third value, by this reason we are using this line of code.
|
1 |
slice = series.slices()[2] |
OK now i have said that when you want to create some kind of charts in PyQtChart, creating of QChart and QChartView are important for every kind of charts.
|
1 2 3 4 5 6 7 8 9 |
chart = QChart() chart.legend().hide() chart.addSeries(series) chart.createDefaultAxes() chart.setAnimationOptions(QChart.SeriesAnimations) chart.setTitle("Pie Chart Example") chart.legend().setVisible(True) chart.legend().setAlignment(Qt.AlignBottom) |
So in the code first we have created the object of QChart, and this line of code is hiding of the chart legend.
|
1 |
chart.legend().hide() |
This is used for creating of default axes for the chart.
|
1 |
chart.createDefaultAxes() |
These codes are for creating animation for our chart with title.
|
1 2 |
chart.setAnimationOptions(QChart.SeriesAnimations) chart.setTitle("Pie Chart Example") |
And at the end we create our QChartView and we add our QChart object in our ChartView.
|
1 |
chartview = QChartView(chart) |
Also we need to make chartview as centeral widget of our window, if we don’t do this, there will not be any chart in the window.
|
1 |
self.setCentralWidget(chartview) |
Also every PyQt5 application must create an application object. The sys.argv parameter is a list of arguments from a command line. Python scripts can be run from the shell. It is a way how we can control the startup of our scripts.
|
1 |
App = QApplication(sys.argv) |
Finally, we enter the mainloop of the application. The event handling starts from this point. The mainloop receives events from the window system and dispatches them to the application widgets. The mainloop ends if we call the exit() method or the main widget is destroyed. The sys.exit() method ensures a clean exit. The environment will be informed how the application ended.
|
1 |
sys.exit(App.exec_()) |
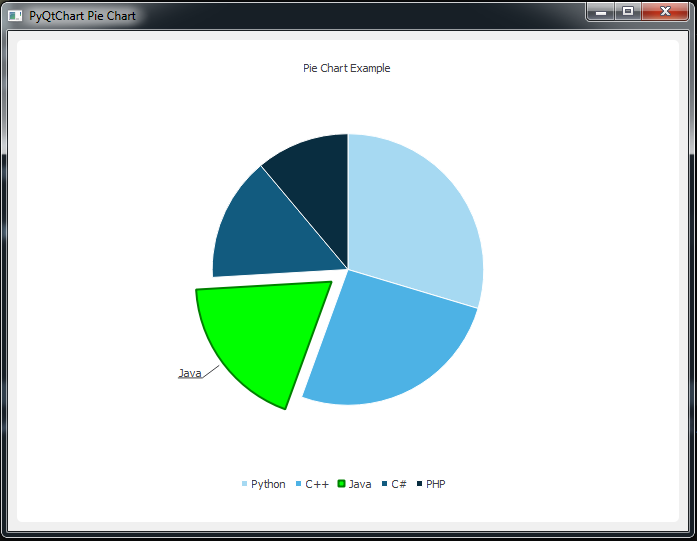
So now run the complete code and this will be the result
Also you can watch the complete video for this article
Please tell me the version of Python and pyqt5 you are using in this task.
iam using python 3.6 and my pyqt5 version is 5.12