In this Python TKinter article i want to show How To Add Legends In TKinter Matplotlib Window.
if you are interested in Python GUI Development, you can check the below links.
Also you can read more articles on Python GUI Development
1: PyQt5 GUI Development Tutorials
2: Pyside2 GUI Development Tutorials
3: wxPython GUI Development Tutorials
4: Kivy GUI Development Tutorials
What Is Matplotlib ?
Matplotlib is a Python 2D plotting library which produces publication quality figures in a variety
of hardcopy formats and interactive environments across platforms. Matplotlib can be used in
Python scripts, the Python and IPython shells, the Jupyter notebook, web application servers,
and four graphical user interface toolkits.
This is the complete source code for this article
1 2 3 4 5 6 7 8 9 10 11 12 13 14 15 16 17 18 19 20 21 22 23 24 25 26 27 28 29 30 31 32 33 34 35 36 37 38 39 40 41 42 43 44 45 46 | from tkinter import * from matplotlib.figure import Figure from matplotlib.backends.backend_tkagg import FigureCanvasTkAgg, NavigationToolbar2TkAgg class Root(Tk): def __init__(self): super(Root, self).__init__() self.title("Python Tkinter Adding Legends") self.minsize(640, 400) self.wm_iconbitmap('icon.ico') self.matplotCanvas() def matplotCanvas(self): fig = Figure(figsize=(12, 5), facecolor='white') axis = fig.add_subplot(111) xValues = [1, 2, 3, 4] yValues0 = [6, 7.5, 8, 7.5] yValues1 = [5.5, 6.5, 8, 6] yValues2 = [6.5, 7, 8, 7] t0, = axis.plot(xValues, yValues0) t1, = axis.plot(xValues, yValues1) t2, = axis.plot(xValues, yValues2) axis.set_ylabel('Vertical Label') axis.set_xlabel('Horizontal Label') axis.grid() fig.legend((t0, t1, t2), ('First line', 'Second line', 'Third Line '), 'upper right') canvas = FigureCanvasTkAgg(fig, self) canvas.show() canvas.get_tk_widget().pack(side=BOTTOM, fill=BOTH, expand=True) toolbar = NavigationToolbar2TkAgg(canvas, self) toolbar.update() canvas._tkcanvas.pack(side=TOP, fill=BOTH, expand=True) root = Root() root.mainloop() |
First of all we have imported our required classes that we need, basically we need the class
from tkinter library along with matplotlib library.
1 2 3 | from tkinter import * from matplotlib.figure import Figure from matplotlib.backends.backend_tkagg import FigureCanvasTkAgg, NavigationToolbar2TkAgg |
So this is the method that we are going to create our Matplotlib canvas, with our data that we
want to plot also in this method we create the legends.
1 2 3 4 5 6 7 8 9 10 11 12 13 14 15 16 17 18 19 20 21 | def matplotCanvas(self): fig = Figure(figsize=(12, 5), facecolor='white') axis = fig.add_subplot(111) xValues = [1, 2, 3, 4] yValues0 = [6, 7.5, 8, 7.5] yValues1 = [5.5, 6.5, 8, 6] yValues2 = [6.5, 7, 8, 7] t0, = axis.plot(xValues, yValues0) t1, = axis.plot(xValues, yValues1) t2, = axis.plot(xValues, yValues2) axis.set_ylabel('Vertical Label') axis.set_xlabel('Horizontal Label') axis.grid() fig.legend((t0, t1, t2), ('First line', 'Second line', 'Third Line '), 'upper right') canvas = FigureCanvasTkAgg(fig, self) canvas.show() canvas.get_tk_widget().pack(side=BOTTOM, fill=BOTH, expand=True) toolbar = NavigationToolbar2TkAgg(canvas, self) toolbar.update() canvas._tkcanvas.pack(side=TOP, fill=BOTH, expand=True) |
These are the values that we want to plot
1 2 3 4 | xValues = [1, 2, 3, 4] yValues0 = [6, 7.5, 8, 7.5] yValues1 = [5.5, 6.5, 8, 6] yValues2 = [6.5, 7, 8, 7] |
These are the labels for our Matplotlib.
1 2 | axis.set_ylabel('Vertical Label') axis.set_xlabel('Horizontal Label') |
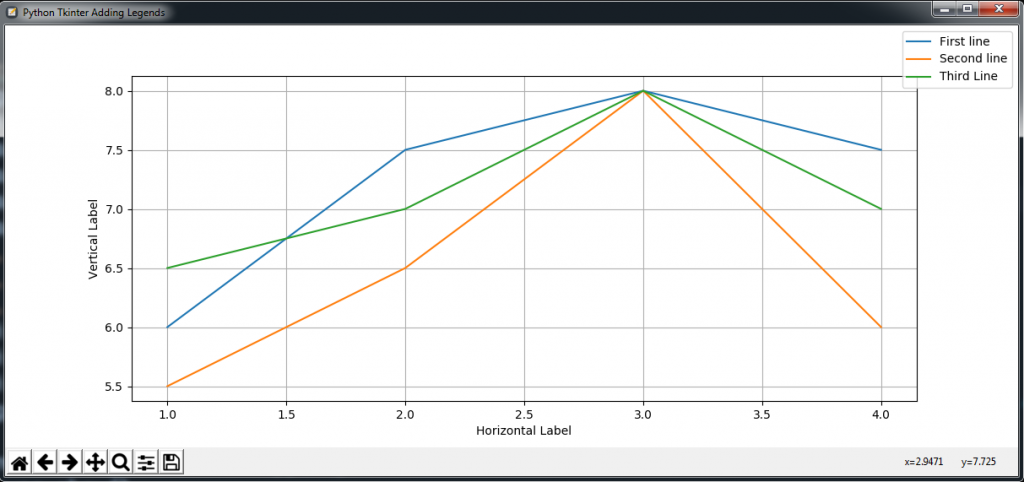
This is the legends for our Matplotlib.
1 | fig.legend((t0, t1, t2), ('First line', 'Second line', 'Third Line '), 'upper right') |
Run the complete code and this will be the result
Also you can watch the complete video for this article