In this Matplotlib article we are going to learn How to Create Scatter Plot in Matplotlib Scatter Plot, so when it comes to visualizing the relationship between two numerical variables, scatter plots are an excellent choice, and in this article we will focus on creating scatter plot using Matplotlib library, Matplotlib is one of the famous Python library for data visualization.
First of all we need to install Python Matplotlib
|
1 |
pip install matplotlib |
For creating scatter plots, we need to import the necessary libraries. In this case, we will import Matplotlib pyplot module, which provides a simple and easy interface for creating different types of plots.
|
1 |
import matplotlib.pyplot as plt |
To illustrate scatter plotting, let’s consider a hypothetical example where we have two variables, x and y. We can represent this data using two lists.
|
1 2 |
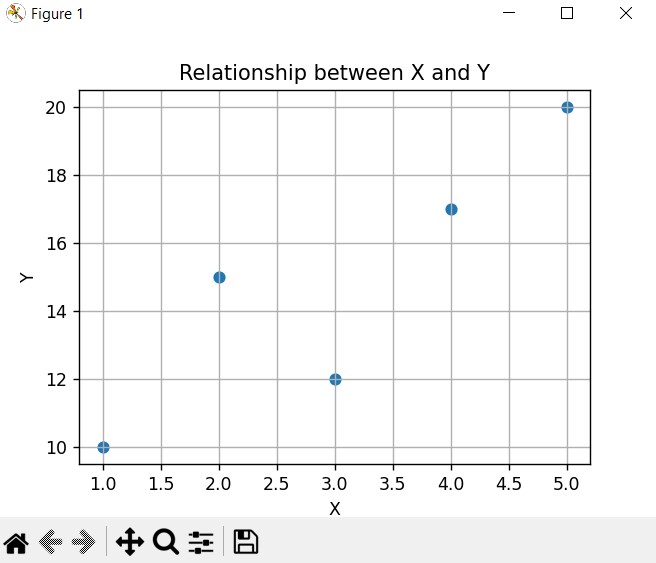
x = [1, 2, 3, 4, 5] y = [10, 15, 12, 17, 20] |
With the data ready, we can now create the scatter plot using the plt.scatter() function. This function requires two parameters, the x-values and the y-values.
|
1 |
plt.scatter(x, y) |
Matplotlib provides different customization options to enhance the appearance of our scatter plot. We can add labels, titles, gridlines, adjust marker size, color and many more.
|
1 2 3 4 |
plt.title("Relationship between X and Y") plt.xlabel("X") plt.ylabel("Y") plt.grid(True) |
After that we have customized our scatter plot, we can choose to either display it or save it as an image. To display the plot, use the plt.show() function.
|
1 |
plt.show() |
If you wish to save the scatter plot as an image, you can use the plt.savefig() function instead.
|
1 |
plt.savefig("scatter_plot.png") |
This is the complete code for this article
|
1 2 3 4 5 6 7 8 9 10 11 12 13 |
import matplotlib.pyplot as plt x = [1, 2, 3, 4, 5] y = [10, 15, 12, 17, 20] plt.scatter(x, y) plt.title("Relationship between X and Y") plt.xlabel("X") plt.ylabel("Y") plt.grid(True) plt.show() plt.savefig("scatter_plot.png") |
Run the code and this will be the result
Learn More on Python Matplotlib
- Learn Python Matplotlib
- Data Visualization in Matplotlib
- How to Create Plotting Styles in Matplotlib
- How to Create Time Series in Matplotlib
- How to Customize Matplotlib Graphs
- How to Create Interactive Plots in Matplotlib
- Matplotlib Histogram
- 3D Plot in Matplotlib
- How to Create Subplots with Matplotlib
- Matplotlib Animation
Subscribe and Get Free Video Courses & Articles in your Email