In this Matplotlib article we want to learn How to Create Interactive Plots in Matplotlib, so Matplotlib library offers different tools for creating static plots, but some times what if you want to take your data visualization to the next level ? for example you want to create interactive plots. Interactive plots allows you to interact with your data, zoom in and out, pan across the plot and explore specific data points, so in this tutorial we create interactive plots in Matplotlib
First of all we need to install Python Matplotlib
|
1 |
pip install matplotlib |
Also we need to install the mplcursors library, which enhances interactivity with Matplotlib plots:
|
1 |
pip install mplcursors |
First of all we need to import the required modules from matplotlib.
|
1 2 3 |
import matplotlib.pyplot as plt import numpy as np import mplcursors |
For demonstrating interactive plots, we need to generate some random data using numpy. We will create two arrays, x and y, to represent the coordinates of the data points.
|
1 2 |
x = np.linspace(0, 10, 100) y = np.sin(x) |
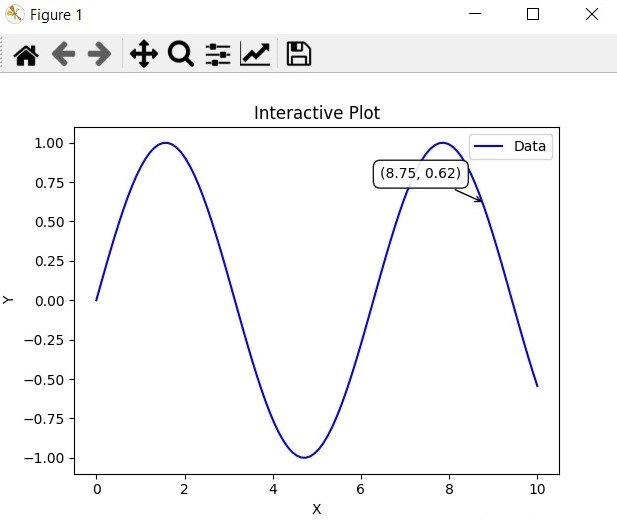
Using Matplotlib plot() function, we can create the initial plot. After that we want to use the mplcursors.cursor() function to add interactivity to the plot, in here we have created a figure and axes object, plot the data, and after that created a cursor object. on_add function is a callback that specifies the behavior when the cursor is added to a specific data point. In this case, it displays the coordinates of the selected point.
|
1 2 3 4 5 6 7 8 9 10 |
fig, ax = plt.subplots() ax.plot(x, y, 'b-', label='Data') cursor = mplcursors.cursor(ax, hover=True) @cursor.connect("add") def on_add(sel): x, y = sel.target sel.annotation.set_text(f"({x:.2f}, {y:.2f})") sel.annotation.get_bbox_patch().set(fc="white", ec="black", lw=1, alpha=0.9) |
Matplotlib provides different customization options to enhance the appearance of the interactive plot. You can add labels, change colors, adjust the axis limits and many more.
|
1 2 3 4 5 6 |
ax.set_xlabel('X') ax.set_ylabel('Y') ax.set_title('Interactive Plot') ax.legend() plt.show() |
This is the complete code for this tutorial
|
1 2 3 4 5 6 7 8 9 10 11 12 13 14 15 16 17 18 19 20 21 22 23 24 25 26 27 28 |
import matplotlib.pyplot as plt import numpy as np import mplcursors # Generate Sample Data x = np.linspace(0, 10, 100) y = np.sin(x) # Create the Interactive Plot fig, ax = plt.subplots() ax.plot(x, y, 'b-', label='Data') cursor = mplcursors.cursor(ax, hover=True) @cursor.connect("add") def on_add(sel): x, y = sel.target sel.annotation.set_text(f"({x:.2f}, {y:.2f})") sel.annotation.get_bbox_patch().set(fc="white", ec="black", lw=1, alpha=0.9) # Customize the Interactive Plot ax.set_xlabel('X') ax.set_ylabel('Y') ax.set_title('Interactive Plot') ax.legend() # Display the Interactive Plot plt.show() |
After running the code, you will see the interactive plot. Hover your mouse over the data points to see the coordinates displayed in a tooltip like box.
Learn More on Python Matplotlib
- Learn Python Matplotlib
- Data Visualization in Matplotlib
- How to Create Plotting Styles in Matplotlib
- How to Create Time Series in Matplotlib
- How to Customize Matplotlib Graphs
Subscribe and Get Free Video Courses & Articles in your Email