In this Matplotlib article we want to learn How to Create Time Series in Matplotlib, so as we know that Matplotlib library provides powerful tools for creating informative time series visualizations, so int his lesson we want to learn creating time series in Matplotlib.
First you should install matplotlib, if you have not installed you can use pip for that like this.
|
1 |
pip install matplotlib |
After installation, we need to import the required classes from matplotlib.
|
1 2 3 4 |
import matplotlib.pyplot as plt import pandas as pd from datetime import datetime from matplotlib.dates import DateFormatter |
For demonstrating time series visualization, we need to add some dummy data. We will assume that the data is stored like CSV and contains two columns, date and value. We want to use pandas to read the data and convert the date column to a datetime format, I have added the data manually but you can load from a CSV file.
|
1 2 3 4 5 6 7 8 9 10 11 12 |
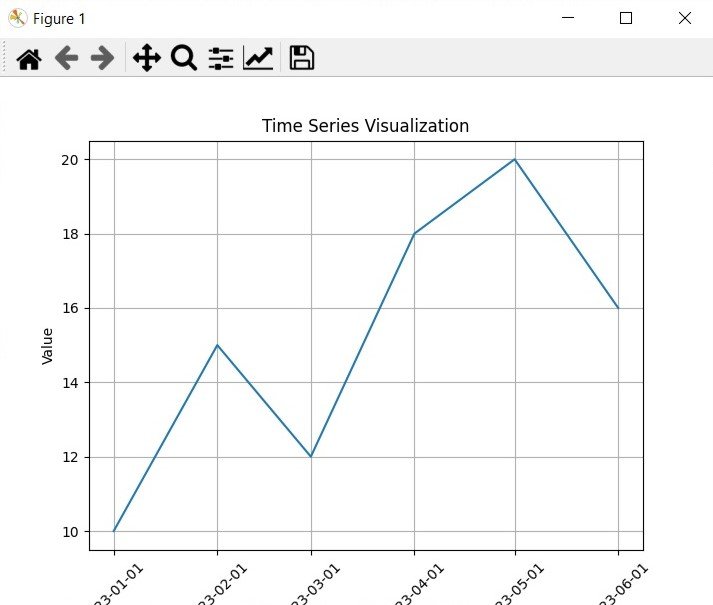
dates = [ datetime(2023, 1, 1), datetime(2023, 2, 1), datetime(2023, 3, 1), datetime(2023, 4, 1), datetime(2023, 5, 1), datetime(2023, 6, 1) ] values = [10, 15, 12, 18, 20, 16] data = pd.DataFrame({'date': dates, 'value': values}) |
Using Matplotlib plot() function, we can create a time series plot based on the loaded data.
|
1 |
plt.plot(data['date'], data['value']) |
Matplotlib provides different customization options to enhance the appearance and clarity of time series visualizations. Let’s create some of them, These are just a few examples of the many customization options available. You can modify labels, titles, axis formats, tick rotations, gridlines, plot sizes and many more according to your specific requirements.
|
1 2 3 4 5 6 7 8 9 10 |
plt.xlabel('Date') plt.ylabel('Value') plt.title('Time Series Visualization') plt.gca().xaxis.set_major_formatter(DateFormatter('%Y-%m-%d')) plt.xticks(rotation=45) plt.grid(True) plt.figure(figsize=(10, 6)) |
We can use this for showing our plot.
|
1 |
plt.show() |
This is the complete code for this article
|
1 2 3 4 5 6 7 8 9 10 11 12 13 14 15 16 17 18 19 20 21 22 23 24 25 26 27 28 29 30 31 32 33 34 35 36 37 38 39 |
import matplotlib.pyplot as plt import pandas as pd from datetime import datetime from matplotlib.dates import DateFormatter # Manually Create Time Series Data dates = [ datetime(2023, 1, 1), datetime(2023, 2, 1), datetime(2023, 3, 1), datetime(2023, 4, 1), datetime(2023, 5, 1), datetime(2023, 6, 1) ] values = [10, 15, 12, 18, 20, 16] # Convert Data to DataFrame data = pd.DataFrame({'date': dates, 'value': values}) # Create the Time Series Plot plt.plot(data['date'], data['value']) # Customize the Time Series Plot plt.xlabel('Date') plt.ylabel('Value') plt.title('Time Series Visualization') plt.gca().xaxis.set_major_formatter(DateFormatter('%Y-%m-%d')) plt.xticks(rotation=45) plt.grid(True) plt.figure(figsize=(10, 6)) # Display the Time Series Plot plt.show() # Save the Time Series Plot as an Image # plt.savefig('time_series_plot.png') |
Run your code and this is the result
Learn More on Python Matplotlib
- Learn Python Matplotlib
- Data Visualization in Matplotlib
- How to Create Plotting Styles in Matplotlib
Subscribe and Get Free Video Courses & Articles in your Email
