In this Matplotlib article we want to learn How to Create Subplots with Matplotlib, when you want to create data visualization, then sometimes you will need to display multiple plots side by side to compare and contrast different aspects of the data. Python Matplotlib library provides a powerful feature called subplots, and it allows us to create multiple plots inside a single figure.
First of all we need to install Matplotlib and you can use pip for the installation of Matplotlib.
|
1 |
pip install matplotlib |
After that we need to import our required modules from Python Matplotlib.
|
1 2 |
import matplotlib.pyplot as plt import numpy as np |
to create subplots with Matplotlib , we use the plt.subplots() function. This function returns a figure object and an array of axes objects, which represent each subplot. We can specify the number of rows and columns of subplots we want using the nrows and ncols parameters.
|
1 |
fig, axes = plt.subplots(nrows=2, ncols=2) |
After that we have the subplots, we can plot our data on each subplot individually using the axes objects. We can access the axes using indexing notation.
|
1 2 3 4 5 6 7 8 9 10 11 12 13 14 15 |
# Plot on the first subplot axes[0, 0].plot([1, 2, 3, 4], [1, 4, 2, 3]) axes[0, 0].set_title('Plot 1') # Plot on the second subplot axes[0, 1].scatter(np.random.rand(10), np.random.rand(10)) axes[0, 1].set_title('Plot 2') # Plot on the third subplot axes[1, 0].bar(['A', 'B', 'C'], [3, 5, 2]) axes[1, 0].set_title('Plot 3') # Plot on the fourth subplot axes[1, 1].hist(np.random.randn(100)) axes[1, 1].set_title('Plot 4') |
Matplotlib provides different customization options for subplots. You can set titles, labels, legends, adjust axis limits and more on each individual subplot.
|
1 2 3 4 5 |
axes[0, 0].set_xlabel('X Label') axes[0, 0].set_ylabel('Y Label') axes[0, 0].legend() # Repeat customization for other subplots |
If the subplots overlap or have insufficient space, we can adjust the layout using the plt.tight_layout() function. This ensures that all subplots are properly spaced and visible.
|
1 |
plt.tight_layout() |
To displaying the subplots, we can use the plt.show() function.
|
1 |
plt.show() |
This is the complete code for this article
|
1 2 3 4 5 6 7 8 9 10 11 12 13 14 15 16 17 18 19 20 21 22 23 24 25 26 27 28 29 30 31 32 33 34 35 |
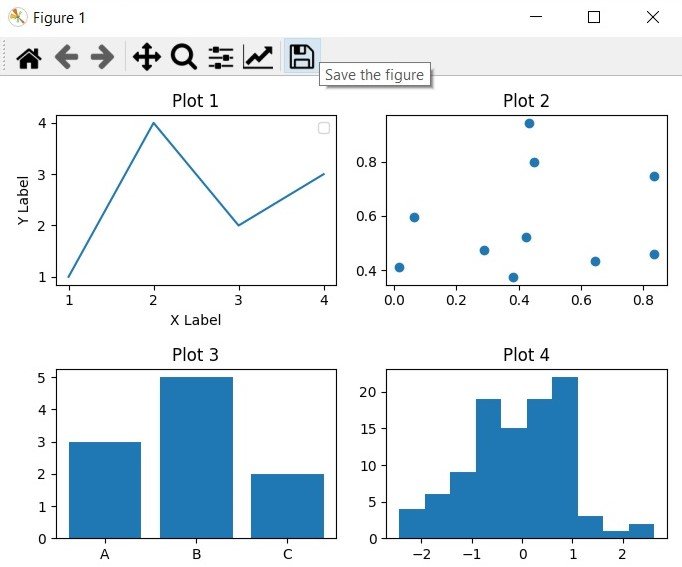
import matplotlib.pyplot as plt import numpy as np # Create Subplots fig, axes = plt.subplots(nrows=2, ncols=2) # Plot on the first subplot axes[0, 0].plot([1, 2, 3, 4], [1, 4, 2, 3]) axes[0, 0].set_title('Plot 1') # Plot on the second subplot axes[0, 1].scatter(np.random.rand(10), np.random.rand(10)) axes[0, 1].set_title('Plot 2') # Plot on the third subplot axes[1, 0].bar(['A', 'B', 'C'], [3, 5, 2]) axes[1, 0].set_title('Plot 3') # Plot on the fourth subplot axes[1, 1].hist(np.random.randn(100)) axes[1, 1].set_title('Plot 4') # Customize the Subplots axes[0, 0].set_xlabel('X Label') axes[0, 0].set_ylabel('Y Label') axes[0, 0].legend() # Adjust Subplot Layout plt.tight_layout() # Display the Subplots plt.show() # Save the Subplots as Image # plt.savefig('subplots.png') |
Run the code and this will be the output
Learn More on Python Matplotlib
- Learn Python Matplotlib
- Data Visualization in Matplotlib
- How to Create Plotting Styles in Matplotlib
- How to Create Time Series in Matplotlib
- How to Customize Matplotlib Graphs
- How to Create Interactive Plots in Matplotlib
- Matplotlib Histogram
- 3D Plot in Matplotlib
Subscribe and Get Free Video Courses & Articles in your Email