In this article we want to learn about Matplotlib Animation, we already know that Matplotlib library provides easy capabilities for creating animated visualizations, in this tutorial we want to talk about this concept.
First of all you need to install Matplotlib and you can use pip for matplotlib installation.
|
1 |
pip install matplotlib |
After installation, we need to import our required modules from matplotlbi library.
|
1 2 |
import matplotlib.pyplot as plt import matplotlib.animation as animation |
After that we need to create some dummy data, because we are going to create a line plot that gradually updates over time.
|
1 2 |
x = [0, 1, 2, 3, 4, 5] y = [0, 1, 4, 9, 16, 25] |
Using Matplotlib animation module, we can create the animated plot. we can define an update our function that specifies how the plot should change at each frame. in our code FuncAnimation class is used to create the animation, and it takes the figure, update function, number of frames,and interval (in milliseconds) as parameters.
|
1 2 3 4 5 6 7 8 9 10 |
fig, ax = plt.subplots() def update(frame): ax.clear() ax.plot(x[:frame+1], y[:frame+1]) ax.set_xlim(0, 5) ax.set_ylim(0, 25) ax.set_title("Animated Plot") ani = animation.FuncAnimation(fig, update, frames=len(x), interval=500) |
For displaying the animated plot, we can use the plt.show() function.
|
1 |
plt.show() |
If you want to to save the animation as a video file, you can use the save method of the FuncAnimation object.
|
1 |
ani.save("animation.mp4", writer="ffmpeg") |
This is the complete code for this article
|
1 2 3 4 5 6 7 8 9 10 11 12 13 14 15 16 17 18 19 20 21 22 23 24 |
import matplotlib.pyplot as plt import matplotlib.animation as animation # Prepare the Data x = [0, 1, 2, 3, 4, 5] y = [0, 1, 4, 9, 16, 25] # Create the Animation fig, ax = plt.subplots() def update(frame): ax.clear() ax.plot(x[:frame+1], y[:frame+1]) ax.set_xlim(0, 5) ax.set_ylim(0, 25) ax.set_title("Animated Plot") ani = animation.FuncAnimation(fig, update, frames=len(x), interval=500) # Display the Animation plt.show() # Save the Animation ani.save("animation.mp4", writer="ffmpeg") |
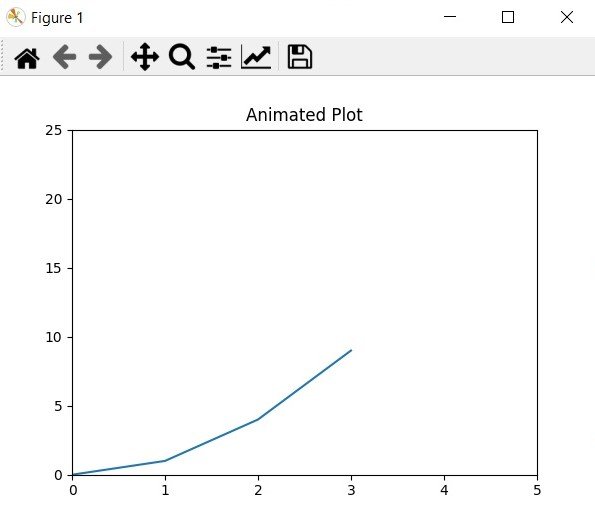
Run your code and this will be the output

So in this article we have successfully created an animated plot using Matplotlib Python animation. Animated visualizations are a powerful tool for showcasing dynamic data or processes. With Matplotlib animation module, you can create informative animated plots.
Learn More on Python Matplotlib
- Learn Python Matplotlib
- Data Visualization in Matplotlib
- How to Create Plotting Styles in Matplotlib
- How to Create Time Series in Matplotlib
- How to Customize Matplotlib Graphs
- How to Create Interactive Plots in Matplotlib
- Matplotlib Histogram
- 3D Plot in Matplotlib
- How to Create Subplots with Matplotlib
Subscribe and Get Free Video Courses & Articles in your Email