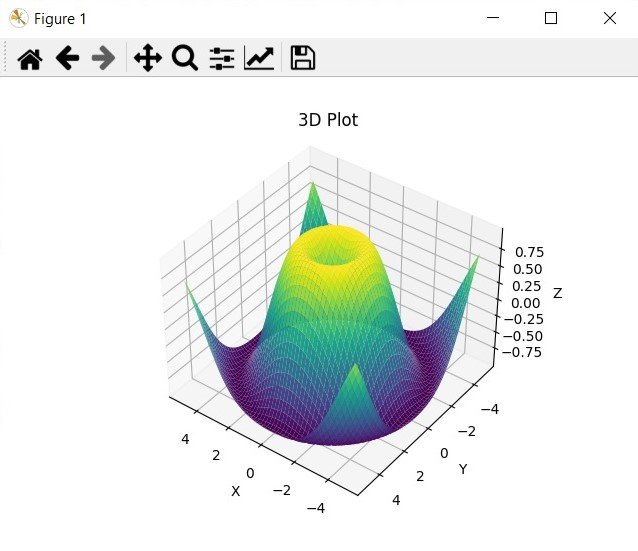
In this Matplotlib article we are going to learn How to Create 3D Plot in Python Matplotlib, so data visualization becomes even more powerful when we can explore the data in three dimensions. Python Matplotlib library provides easy capabilities for creating 3D plots, and you can use that to visualize complex relationships and patterns in our data.
For plotting 3D plots, first we need to install Matplotlib library.
|
1 |
pip install matplotlib |
For creating a 3D plot, we start by creating a figure and axes using plt.subplots() function. we pass the subplot_kw parameter with the keyword argument projection=3d to specify that we want a 3D plot.
|
1 |
fig, ax = plt.subplots(subplot_kw={'projection': '3d'}) |
For demonstrating the 3D plot, we can generate some dummy data. we want to create three arrays x, y, and z, these arrays represent the coordinates in the 3D space.
|
1 2 3 4 5 6 |
import numpy as np x = np.linspace(-5, 5, 100) y = np.linspace(-5, 5, 100) x, y = np.meshgrid(x, y) z = np.sin(np.sqrt(x**2 + y**2)) |
We can use the plot_surface() function, we can create a 3D plot surface based on the generated data.
|
1 |
ax.plot_surface(x, y, z, cmap='viridis') |
Matplotlib provides different customization options for 3D plots. You can add labels, change colors, adjust viewing angles and many more.
|
1 2 3 4 5 |
ax.set_xlabel('X') ax.set_ylabel('Y') ax.set_zlabel('Z') ax.set_title('3D Plot') ax.view_init(elev=30, azim=45) |
For showing the 3D plot, we can use the plt.show() function.
|
1 |
plt.show() |
Also If you want to save the 3D plot as an image, you can use plt.savefig() function instead.
|
1 |
plt.savefig('3d_plot.png') |
This is the complete code for this article
|
1 2 3 4 5 6 7 8 9 10 11 12 13 14 15 16 17 18 19 20 21 22 23 24 25 26 27 28 |
import matplotlib.pyplot as plt import numpy as np # Create a Figure and Axes fig = plt.figure() ax = plt.axes(projection='3d') # Generate Data x = np.linspace(-5, 5, 100) y = np.linspace(-5, 5, 100) x, y = np.meshgrid(x, y) z = np.sin(np.sqrt(x**2 + y**2)) # Create the 3D Plot ax.plot_surface(x, y, z, cmap='viridis') # Customize the Plot ax.set_xlabel('X') ax.set_ylabel('Y') ax.set_zlabel('Z') ax.set_title('3D Plot') ax.view_init(elev=30, azim=45) # Display the 3D Plot plt.show() # Save the 3D Plot as an Image # plt.savefig('3d_plot.png') |
Run the complete code and this will be the output

Learn More on Python Matplotlib
- Learn Python Matplotlib
- Data Visualization in Matplotlib
- How to Create Plotting Styles in Matplotlib
- How to Create Time Series in Matplotlib
- How to Customize Matplotlib Graphs
- How to Create Interactive Plots in Matplotlib
- Matplotlib Histogram
Subscribe and Get Free Video Courses & Articles in your Email