In this PyqtGraph Tutorial i want to show you How To Create Legend.
before this we had some articles on PyqtGraph , so you can check the articles in the below link.
1: Pyqtgraph Introduction, Installation & Drawing First Line
2: How to Draw Scatter Plot in Pyqtgraph
3: How to Plot BarGraph in PyqtGraph
4: How to Plot Data Curves in PyqtGraph
What are Legends ?
Legends are a useful way to label data series plotted on a graph. These examples show how to create a legend and make some common modifications,
So now this is the complete code for PyqtGraph Tutorial How To Create Legend
|
1 2 3 4 5 6 7 8 9 10 11 12 13 14 15 16 17 18 |
import sys from PyQt5.QtWidgets import QApplication import pyqtgraph as pg app = QApplication(sys.argv) plt = pg.plot() plt.setWindowTitle('pyqtgraph example: Legend') plt.addLegend() c1 = plt.plot([1,3,2,4], pen='r', name='red plot') c2 = plt.plot([2,1,4,3], pen='g', fillLevel=0, fillBrush=(255,255,255,30), name='green plot') c3 = plt.addLine(y=4, pen='y') status = app.exec_() sys.exit(status) |
OK in the above code these are the imports that we need, basically PyQt5 with PyqtGraph.
|
1 2 3 |
import sys from PyQt5.QtWidgets import QApplication import pyqtgraph as pg |
Every PyQt5 application must create an application object. The sys.argv parameter is a list of arguments from a command line.
Python scripts can be run from the shell. It is a way how we can control the startup of our scripts.
|
1 |
app = QApplication(sys.argv) |
In this code we have created pg.plot(), also we have given a title to our graph, after that we added the legend to our graph
|
1 2 3 |
plt = pg.plot() plt.setWindowTitle('pyqtgraph example: Legend') plt.addLegend() |
These are our data that we want to plot
|
1 2 3 |
c1 = plt.plot([1,3,2,4], pen='r', name='red plot') c2 = plt.plot([2,1,4,3], pen='g', fillLevel=0, fillBrush=(255,255,255,30), name='green plot') c3 = plt.addLine(y=4, pen='y') |
Finally, we enter the mainloop of the application. The event handling starts from this point. The mainloop receives events from the window system and dispatches
them to the application widgets. The mainloop ends if we call the exit() method or the main widget is destroyed.
The sys.exit()method ensures a clean exit. The environment will be informed how the application ended.
The exec_() method has an underscore. It is because the exec is a Python keyword. And thus, exec_() was used instead.
|
1 2 |
status = app.exec_() sys.exit(status) |
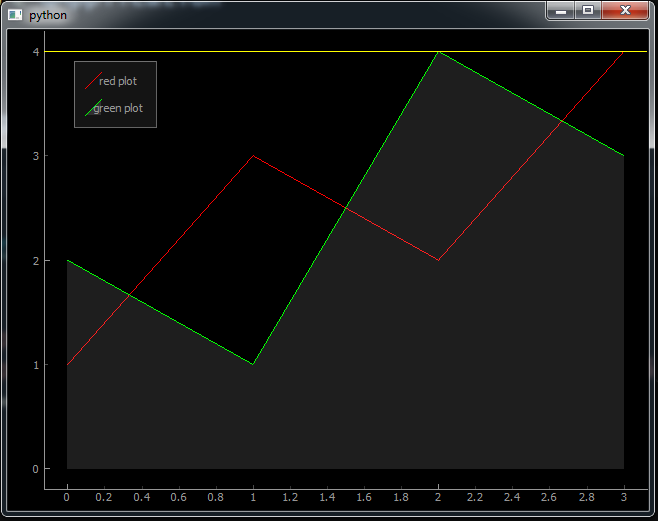
So after runing the complete complete code this will be the result
Also you can watch the complete video for this article
Subscribe and Get Free Video Courses & Articles in your Email