In this article i want to show you How to Plot BarGraph in PyqtGraph.
before this we had two articles on PyqtGraph so you can check those articles in the below link.
1: Pyqtgraph Introduction, Installation & Drawing First Line
2: How to Draw Scatter Plot in Pyqtgraph
What is BarGraph ?
A bar graph is a pictorial rendition of statistical data in which the independent variable can attain only certain discrete values.
The dependent variable may be discrete or continuous. The most common form of bar graph is the vertical bar graph, also called a column graph.
In a vertical bar graph, values of the independent variable are plotted along a horizontal axis from left to right.
Function values are shown as shaded or colored vertical bars of equal thickness extending upward from the horizontal axis to various heights.
In a horizontal bar graph, the independent variable is plotted along a vertical axis from the bottom up. Values of the function are shown
as shaded or colored horizontal bars of equal thickness extending toward the right, with their left ends vertically aligned.
So now this is the complete code for How to Plot BarGraph in PyqtGraph
|
1 2 3 4 5 6 7 8 9 10 11 12 13 14 15 16 17 18 19 20 21 22 23 24 25 26 27 28 29 30 31 32 33 34 35 36 37 38 39 40 41 |
import sys from PyQt5.QtWidgets import QApplication import pyqtgraph as pg import numpy as np app = QApplication(sys.argv) win = pg.plot() x = np.arange(10) y1 = np.sin(x) y2 = 1.1 * np.sin(x+1) y3 = 1.2 * np.sin(x+2) bg1 = pg.BarGraphItem(x=x, height=y1, width=0.3, brush='r') bg2 = pg.BarGraphItem(x=x+0.33, height=y2, width=0.3, brush='g') bg3 = pg.BarGraphItem(x=x+0.66, height=y3, width=0.3, brush='b') win.addItem(bg1) win.addItem(bg2) win.addItem(bg3) # Final example shows how to handle mouse clicks: class BarGraph(pg.BarGraphItem): def mouseClickEvent(self, event): print("clicked") bg = BarGraph(x=x, y=y1*0.3+2, height=0.4+y1*0.2, width=0.8) win.addItem(bg) status = app.exec_() sys.exit(status) |
So in the above code these the imports that we need
|
1 2 3 4 |
import sys from PyQt5.QtWidgets import QApplication import pyqtgraph as pg import numpy as np |
Also in here we have created the object of QApplication and also Pyqtgraph
|
1 2 |
app = QApplication(sys.argv) win = pg.plot() |
These are the data for BarGraph
|
1 2 3 4 |
x = np.arange(10) y1 = np.sin(x) y2 = 1.1 * np.sin(x+1) y3 = 1.2 * np.sin(x+2) |
So in here we are going to create our BarGraph items
|
1 2 3 |
bg1 = pg.BarGraphItem(x=x, height=y1, width=0.3, brush='r') bg2 = pg.BarGraphItem(x=x+0.33, height=y2, width=0.3, brush='g') bg3 = pg.BarGraphItem(x=x+0.66, height=y3, width=0.3, brush='b') |
Also in here we are going to add our BarGraph items to the window
|
1 2 3 |
win.addItem(bg1) win.addItem(bg2) win.addItem(bg3) |
This is for handling mouse clicks for BarGraph items
|
1 2 3 |
class BarGraph(pg.BarGraphItem): def mouseClickEvent(self, event): print("clicked") |
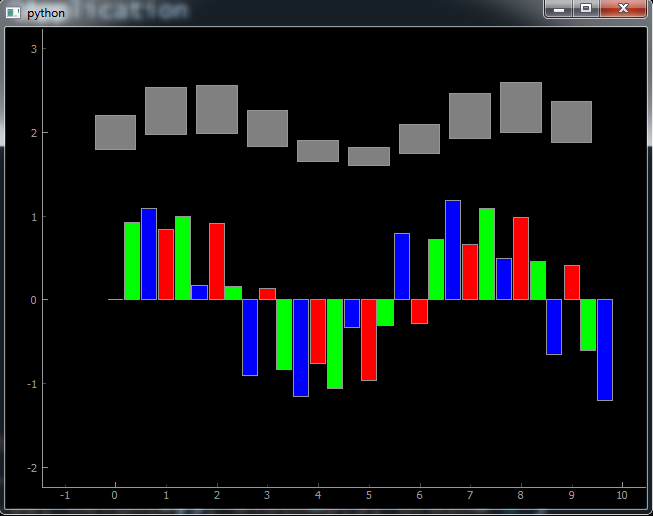
So run the complete code and this will be the result
Also you can watch the complete video for this article
Subscribe and Get Free Video Courses & Articles in your Email