In this Pyqtgraph article i want to show you How To Draw Scatter Plot in Pyqtgraph.
Also check my previous article on Pyqtgraph
1: Pyqtgraph Introduction Installation & Drawing Line
What is Scatter Plot ?
A scatter plot is a two-dimensional data visualization that uses dots to represent the values obtained for two different variables – one plotted along the x-axis and the other plotted along the y-axis.
When to Use Scatter Plots
Scatter plots are used when you want to show the relationship between two variables. Scatter plots are sometimes called correlation plots because they show how two variables are correlated.
So now this is the complete code for How To Draw Scatter Plot in Pyqtgraph
|
1 2 3 4 5 6 7 8 9 10 11 12 13 14 |
import sys from PyQt5.QtWidgets import QApplication import pyqtgraph as pg import numpy as np app = QApplication(sys.argv) x = np.random.normal(size=1000) y = np.random.normal(size=1000) pg.plot(x, y, pen=None, symbol='o') status = app.exec_() sys.exit(status) |
OK now in the above code first we have imported the libraries, basically we have imported Numpy, Pyqt5 and Pyqtgraph
|
1 2 3 4 |
import sys from PyQt5.QtWidgets import QApplication import pyqtgraph as pg import numpy as np |
In this line of code we have created the object of QApplication from PyQt5
|
1 |
app = QApplication(sys.argv) |
And these are the x and y values for our scatter plot, basically we are using random numbers between 1000.
|
1 2 |
x = np.random.normal(size=1000) y = np.random.normal(size=1000) |
In here we have plotted the scatter
|
1 |
pg.plot(x, y, pen=None, symbol='o') |
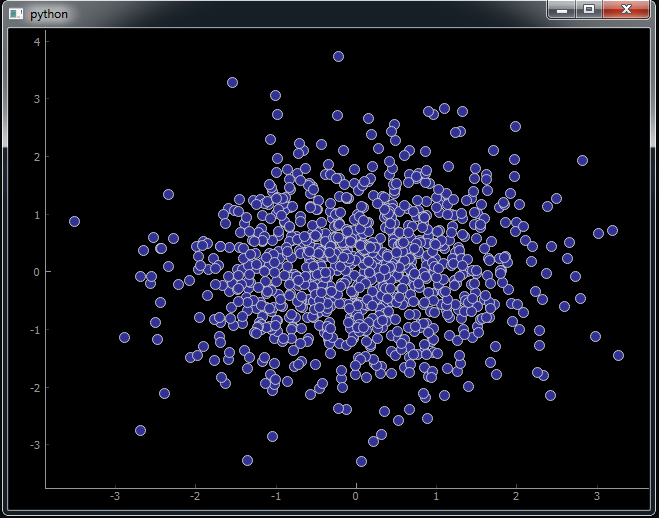
So now run the complete code and this will be the result
Also you can watch the complete video for this article
Subscribe and Get Free Video Courses & Articles in your Email