In this article i want to show How To Plot Data Curves in Pyqtgraph.
before this we had three articles on PyqtGraph , so you can check the articles in the below link.
1: Pyqtgraph Introduction, Installation & Drawing First Line
2: How to Draw Scatter Plot in Pyqtgraph
3: How to Plot BarGraph in PyqtGraph
What is Plot ?
According to Wikipedia a plot is a graphical technique for representing a data set, usually as a graph showing the relationship between two or more variables.
The plot can be drawn by hand or by a mechanical or electronic plotter. Graphs are a visual representation of the relationship between variables,
which are very useful for humans who can then quickly derive an understanding which may not have come from lists of values.
Graphs can also be used to read off the value of an unknown variable plotted as a function of a known one.
So now this is the complete code for How To Plot Data Curves in Pyqtgraph
|
1 2 3 4 5 6 7 8 9 10 11 12 13 14 15 |
import sys from PyQt5.QtWidgets import QApplication import pyqtgraph as pg import numpy as np app = QApplication(sys.argv) x = np.arange(1000) y = np.random.normal(size=(3, 1000)) plotWidget = pg.plot(title="Three plot curves") for i in range(3): plotWidget.plot(x, y[i], pen=(i,3)) status = app.exec_() sys.exit(status) |
OK in the above code first we have imported the needed library and classes
|
1 2 3 4 |
import sys from PyQt5.QtWidgets import QApplication import pyqtgraph as pg import numpy as np |
Every PyQt5 application must create an application object. The sys.argv parameter is a list of arguments from a command line.
Python scripts can be run from the shell. It is a way how we can control the startup of our scripts.
|
1 |
app = QApplication(sys.argv) |
This is the plotting data, we are using numpy for creating the data in a range
|
1 2 |
x = np.arange(1000) y = np.random.normal(size=(3, 1000)) |
In here we create the object of our widget plotting and we give a title
|
1 |
plotWidget = pg.plot(title="Three plot curves") |
Now we plot our data
|
1 2 |
for i in range(3): plotWidget.plot(x, y[i], pen=(i,3)) |
Finally, we enter the mainloop of the application. The event handling starts from this point. The mainloop receives events from the window system and dispatches
them to the application widgets. The mainloop ends if we call the exit() method or the main widget is destroyed.
The sys.exit()method ensures a clean exit. The environment will be informed how the application ended.
The exec_() method has an underscore. It is because the exec is a Python keyword. And thus, exec_() was used instead.
|
1 2 |
status = app.exec_() sys.exit(status) |
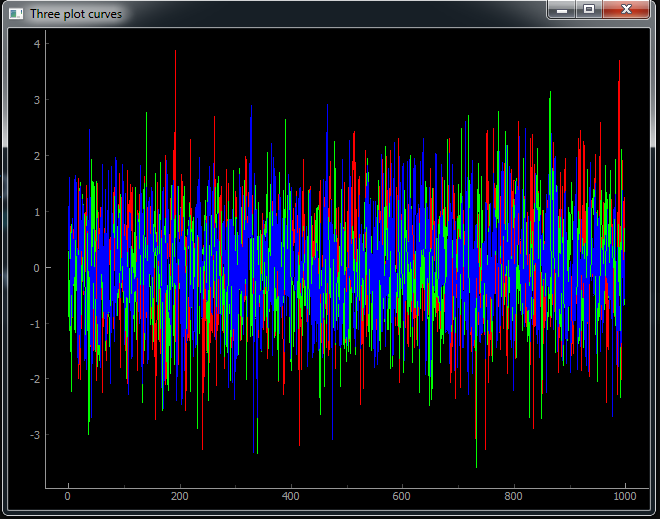
So now if your run the application this will the result
Also you can check the complete video for this article
Subscribe and Get Free Video Courses & Articles in your Email