This is our fifth article in Python Matplotlib, in this article we are going to learn about Matplotlib Plotting PieChart, so a pie chart is a circular statistical graphic, which is divided into slices to illustrate numerical proportion. In a pie chart, the arc length of each slice, is proportional to the quantity it represents. you can read the previous articles for Python Matplotlib in the below links.
Matplotlib Tutorials For Beginners
1: Matplotlib Introduction & Installation
2: Matplotlib Plotting Multiple Curves
3: Matplotlib Plotting Scatter (Points)
4: Matplotlib Plotting BarChart
So now let’s create our first PieChart in Matplotlib.
|
1 2 3 4 5 6 7 8 |
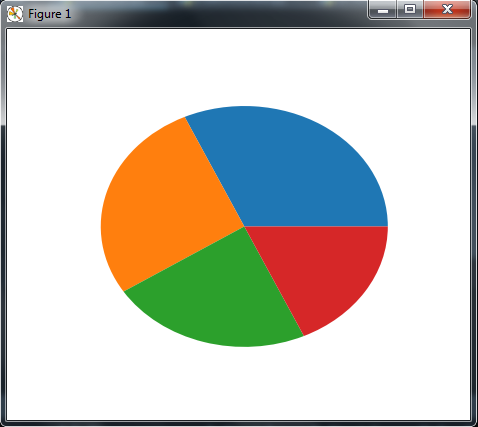
import matplotlib.pyplot as plt programming = [70, 60, 50, 40] plt.pie(programming) plt.show() |
At the top first we have imported our matplotlib library, after that the pyplot.pie() function simply takes a list of values as the input. Note that the input data is a list; it could be a NumPy array. you do not have to adjust the data so that it adds up to 1 or 100. You just have to give values to matplotlib and it will automatically compute the relative areas of the pie chart.
If you run the code this will be the result
Customizing Color of PieChart
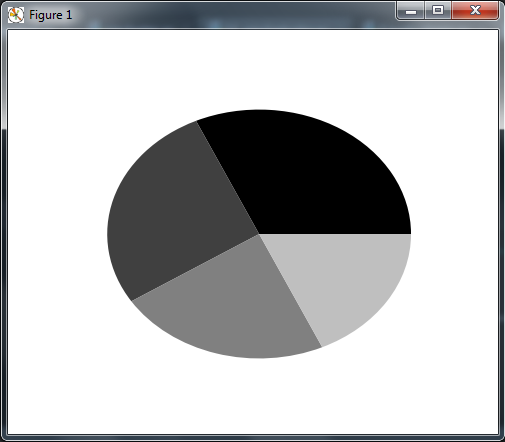
Also you can change the color in the piechart, pie charts are also used in contexts where the color scheme might matter a lot. Pie chart coloring works mostly like in bar charts. In this example, we are going to see how to color pie charts with our own colors.
|
1 2 3 4 5 6 7 8 9 |
import matplotlib.pyplot as plt programming = [70, 60, 50, 40] color_set = ('.00', '.25', '.50', '.75') plt.pie(programming, colors = color_set) plt.show() |
Pie charts accept a list of colors using the colors parameter (beware, it is colors, not color). However, the color list does not have as many elements as the input list of values. If there are less colors than values, then pyplot.pie() will simply cycle through the color list. In the preceding example, we gave a list of four colors to color a pie chart that consisted of four values. but you can add more values, and the pyplot.pie() function cycle through the color list.
So if you run the code this will be the result
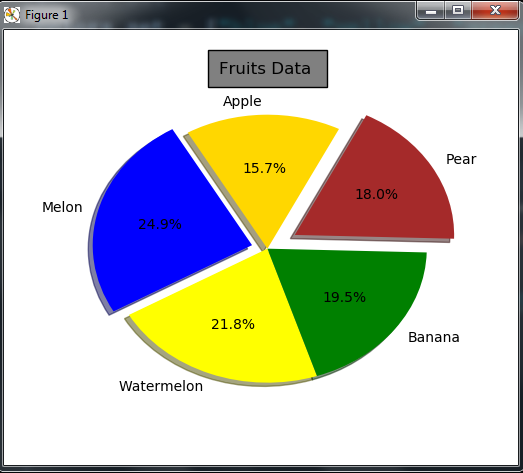
Also you can give title to your PieChart,
|
1 2 3 4 5 6 7 8 9 10 11 12 13 14 15 16 17 18 |
import matplotlib.pyplot as plt # our data fruits = 'Melon', 'Watermelon', 'Banana', 'Pear', 'Apple' data = [18.5, 16.2, 14.5, 13.4, 11.7] #color set colors_set = ["blue", "yellow", "green", "brown", "gold"] # explode 1st and 4th slice explode = (0.1, 0, 0, 0.2, 0) # Plot the data plt.pie(data, explode=explode, labels=fruits, colors=colors_set, autopct='%1.1f%%', shadow=True, startangle=120) plt.title("Fruits Data ", bbox={'facecolor':'0.5', 'pad':8}) plt.show() |
OK in the above code, we have created our data, after that also we have created a color set to give different colors for piechart slices. also we want to explode the first and fourth slice in our PieChart.
If you run the code this will be the result
Subscribe and Get Free Video Courses & Articles in your Email