This is our third article in Python Matplotlib, in this article we are going to learn Matplotlib How to Plot Points. also we can call it scatter plot. you can read the previous article for Python Matplotlib in the below links.
Matplotlib Tutorials For Beginners
1: Matplotlib Introduction & Installation
2: Matplotlib Plotting Multiple Curves
So now this is the code for plotting points.
|
1 2 3 4 5 6 7 8 9 10 |
import numpy as np import matplotlib.pyplot as plt #data points for our plot data = np.random.rand(1000, 2) #plotting as scatter plt.scatter(data[:,0], data[:,1]) plt.show() |
OK in the above code you can see that first of all we have imported our required classes, basically we are using matplotlib and also numpy. The function plt.scatter() works exactly like plt.plot(), taking the x and y coordinates of points as input parameters. However, each point is simply shown with one marker. and there are different optional parameters that you can use with this function. by playing with its many optional parameters, we can achieve many different effects like Colors and Styles.
If you run the code this will be the result.

We can control the colors used for a scatter plot. now let’s just customize the colors for the scatter plot. there are two options for pyplot.scatter() for controlling of dot colors through it’s color parameter, or it’s shortcut c.
- Common color for all the dots: If the color parameter is a valid matplotlib color definition, then all the dots will appear in that color.
- Individual color for each dot: If the color parameter is a sequence of a valid matplotlib color definition, the ith dot will appear in the ith color. Of course, we have to give the required colors for each dot.
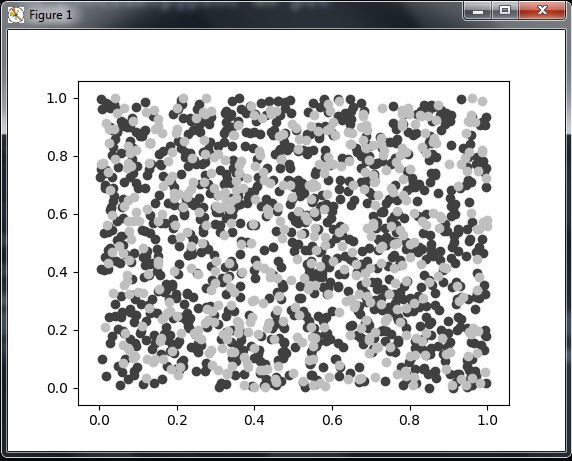
OK now this is the code for changing of dots color.
|
1 2 3 4 5 6 7 8 9 10 11 12 |
import numpy as np import matplotlib.pyplot as plt #data points for our plot data = np.random.rand(1000, 2) data2 = np.random.rand(500, 2) #plotting as scatter plt.scatter(data[:,0], data[:,1],color = '.25') plt.scatter(data2[:,0], data2[:,1],color = '.75') plt.show() |
You can see that in the above code we have given a new parameter of color to pyplot.scatter() function.
If you run the code this will be the result
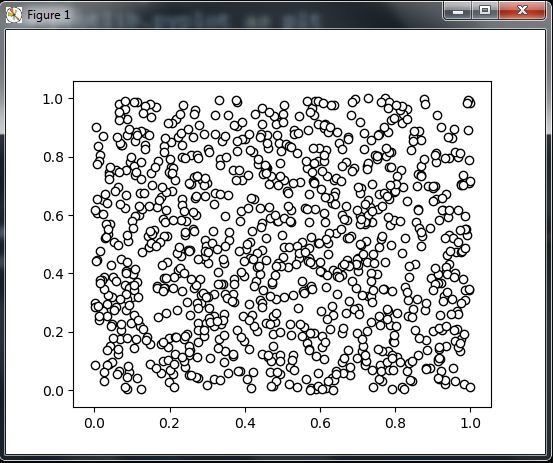
So we have saw that how we can use color parameter for giving color of scatter plot dots, also you can use edgecolor parameter, it controls the color of the edge of the dots. let’s take a look a this example.
|
1 2 3 4 5 6 7 8 9 10 |
import numpy as np import matplotlib.pyplot as plt #data points for our plot data = np.random.rand(1000, 2) #plotting as scatter plt.scatter(data[:,0], data[:,1], color = '1.0', edgecolor='0.0') plt.show() |
If you run the code this will be the result .
Subscribe and Get Free Video Courses & Articles in your Email