In this Matplotlib tutorial we want to learn that How to Show Geospatial Data with Python Matplotlib, so visualizing geospatial data plays an important role in understanding and interpreting complex information. and Python has powerful libraries for data visualization, one of library is Matplotlib, it offers different options for creating informative geospatial visualizations. In this tutorial we are going to practically create some codes about this concept.
First we need to install Matplotlib and you can use pip for that.
|
1 |
pip install matplotlib |
How to Show Geospatial Data with Python Matplotlib
For this tutorial, we are going to use some fake dataset, and it contains all information about earthquake occurrences around the world. dataset is stored in a .csv file, and it includes columns such as latitude, longitude, magnitude, and depth.
This is the fake CSV data that we are using.
|
1 2 3 4 5 |
latitude,longitude,magnitude,depth 34.0522,-118.2437,4.5,10 40.7128,-74.0060,3.2,5 51.5074,-0.1278,2.8,8 37.7749,-122.4194,5.1,12 |
This is the complete code for this article
|
1 2 3 4 5 6 7 8 9 10 11 12 13 14 15 16 17 18 19 20 21 22 23 24 25 26 27 28 29 30 31 32 33 34 35 36 37 38 39 40 41 42 |
import pandas as pd import matplotlib.pyplot as plt # Load the dataset data = pd.read_csv('earthquake_data.csv') print(data.head()) # Prepare the data latitudes = data['latitude'] longitudes = data['longitude'] coordinates = list(zip(longitudes, latitudes)) # Create subplots fig, axs = plt.subplots(1, 3, figsize=(18, 6)) # Plot 1: Basic scatter plot axs[0].scatter(longitudes, latitudes, c='red', alpha=0.5, s=50) axs[0].set_title('Earthquake Occurrences') axs[0].set_xlabel('Longitude') axs[0].set_ylabel('Latitude') axs[0].grid(True) # Plot 2: Color-coded by Magnitude scatter = axs[1].scatter(longitudes, latitudes, c=data['magnitude'], cmap='coolwarm', alpha=0.7, s=50) axs[1].set_title('Earthquake Occurrences (Color-coded by Magnitude)') axs[1].set_xlabel('Longitude') axs[1].set_ylabel('Latitude') axs[1].grid(True) plt.colorbar(scatter, ax=axs[1], label='Magnitude') # Add colorbar to the plot # Plot 3: Marker Size based on Depth axs[2].scatter(longitudes, latitudes, c='red', alpha=0.5, s=data['depth'] * 2) axs[2].set_title('Earthquake Occurrences (Marker Size based on Depth)') axs[2].set_xlabel('Longitude') axs[2].set_ylabel('Latitude') axs[2].grid(True) # Adjust spacing between subplots plt.tight_layout() # Show the plots plt.show() |
Now let’s break down this code, first we have imported our required modules from Matplotlib.
|
1 2 |
import pandas as pd import matplotlib.pyplot as plt |
After that we have loaded the dataset from the .csv file and examine its structure using Pandas, The read_csv function reads the .csv file and stores the data in a Pandas DataFrame. The head() function allows us to view the first few rows of the dataset.
|
1 2 |
data = pd.read_csv('earthquake_data.csv') print(data.head()) |
For visualizing geospatial data, we need latitude and longitude coordinates. In our example dataset, the latitude and longitude information is stored in separate columns. To prepare the data, we extract these columns and create a list of coordinates.
|
1 2 3 |
latitudes = data['latitude'] longitudes = data['longitude'] coordinates = list(zip(longitudes, latitudes)) |
Now that we have the coordinates, we can proceed to create a basic scatter plot using Matplotlib, In this code we have used the scatter() function to create a scatter plot, where each point represents an earthquake occurrence. We set the color (c) to red, the transparency (alpha) to 0.5, and the size (s) to 50. The title(), xlabel(), ylabel(), and grid() functions are used to add labels and gridlines to the plot. and at the end the show() function displays the plot.
|
1 2 3 4 5 6 |
fig, axs = plt.subplots(1, 3, figsize=(18, 6)) axs[0].scatter(longitudes, latitudes, c='red', alpha=0.5, s=50) axs[0].set_title('Earthquake Occurrences') axs[0].set_xlabel('Longitude') axs[0].set_ylabel('Latitude') axs[0].grid(True) |
We can use the magnitude information to color code the scatter plot, and it provides a visual representation of the earthquake intensity, In this example, we pass the magnitude column to the c parameter and specify the coolwarm color map. The colorbar() function creates a color bar legend, and we add a label to it.
|
1 2 3 4 5 6 |
scatter = axs[1].scatter(longitudes, latitudes, c=data['magnitude'], cmap='coolwarm', alpha=0.7, s=50) axs[1].set_title('Earthquake Occurrences (Color-coded by Magnitude)') axs[1].set_xlabel('Longitude') axs[1].set_ylabel('Latitude') axs[1].grid(True) plt.colorbar(scatter, ax=axs[1], label='Magnitude') |
In here we are setting the marker Size based on Depth.
|
1 2 3 4 5 |
axs[2].scatter(longitudes, latitudes, c='red', alpha=0.5, s=data['depth'] * 2) axs[2].set_title('Earthquake Occurrences (Marker Size based on Depth)') axs[2].set_xlabel('Longitude') axs[2].set_ylabel('Latitude') axs[2].grid(True) |
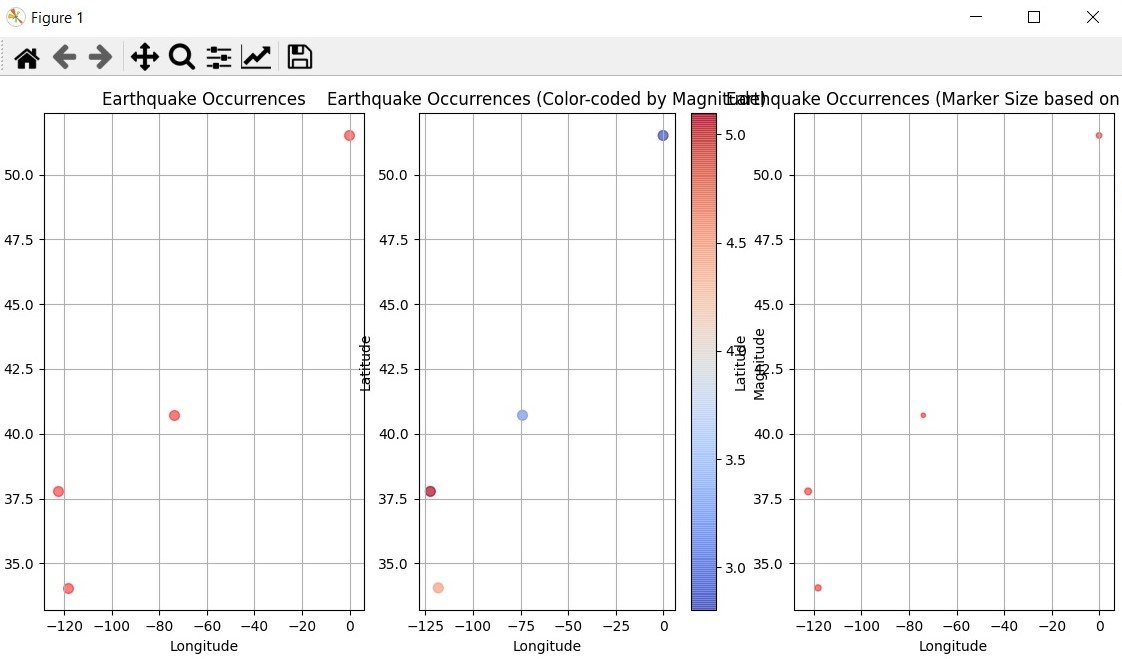
This will be the output
Subscribe and Get Free Video Courses & Articles in your Email
