In this Python Plotly Tutorial we are going to talk about different concepts on Plotly, so Data visualization plays an important role in understanding complex datasets and extracting meaningful insights. Python has different libraries for data visualization, and one of them are Plotly, using Plotly you can build powerful visually appealing and interactive plots.
What is Plotly ?
Plotly is an open source Python library that enables developers to create interactive and visually appealing plots. It offers different chart types, including line plots, scatter plots, bar charts, pie charts, and many more. One of the key advantages of Plotly is its ability to generate plots that can be easily shared and embedded in web applications, notebooks or websites.
Installing Plotly
Before we dive into the tutorial, let’s ensure that Plotly is installed in your Python environment. You can install Plotly using pip like this:
|
1 |
pip install plotly |
Creating Line Plot in Plotly
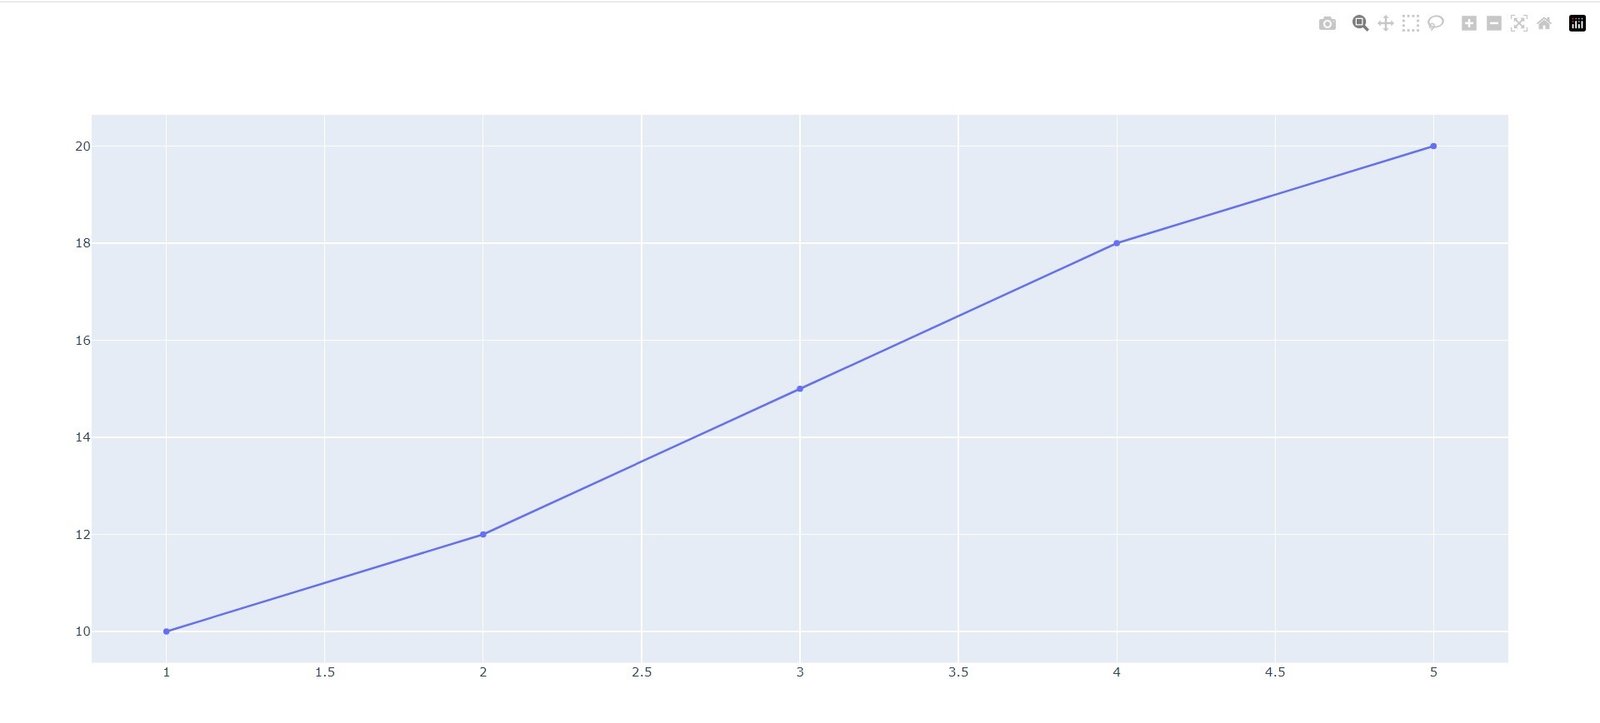
For creating a line plot, we need data points and corresponding x and y coordinates. You can use this example for that, In this example, we import the necessary modules and define the x and y coordinates. after that we have created a Figure object and specify the data as a scatter plot. and lastly we display the plot using the show() method.
|
1 2 3 4 5 6 7 |
import plotly.graph_objects as go x = [1, 2, 3, 4, 5] y = [10, 12, 15, 18, 20] fig = go.Figure(data=go.Scatter(x=x, y=y)) fig.show() |
This will be the output

Python Plotly Tutorial
Creating Bar Chart in Plotly
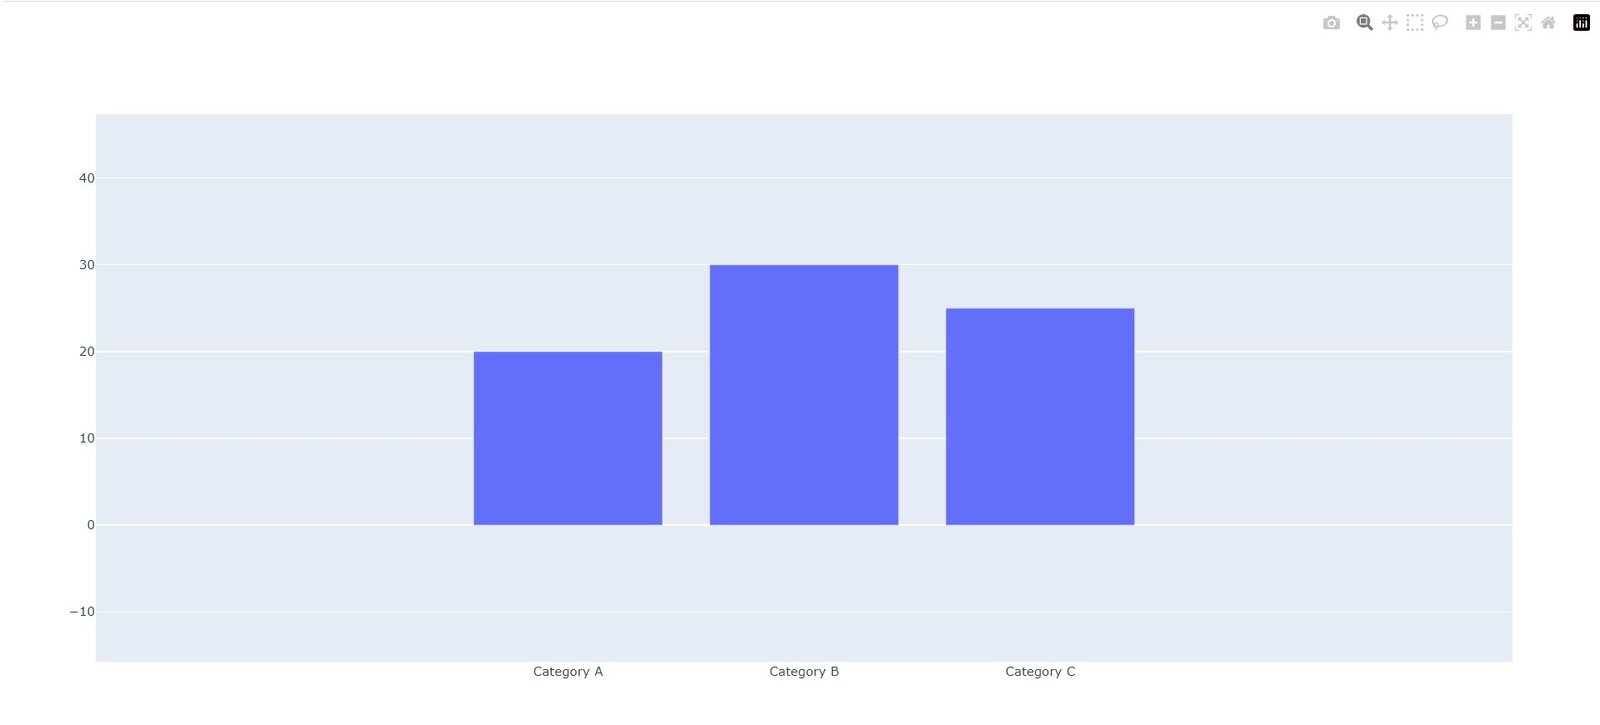
Next, let’s create a bar chart using Plotly, In this example, we have defined the categories and their corresponding values. We creates a Figure object and specify the data as a bar chart. Finally, we display the plot using the show() method.
|
1 2 3 4 5 6 7 |
import plotly.graph_objects as go categories = ['Category A', 'Category B', 'Category C'] values = [20, 30, 25] fig = go.Figure(data=go.Bar(x=categories, y=values)) fig.show() |
This will be the output

Customizing Plots
Plotly provides several customization options to enhance the appearance of your plots.
Colors and Markers
You can change the colors and markers used in your plots. Let’s modify the previous line plot example to include custom colors and markers:
|
1 2 3 4 5 6 7 |
import plotly.graph_objects as go x = [1, 2, 3, 4, 5] y = [10, 12, 15, 18, 20] fig = go.Figure(data=go.Scatter(x=x, y=y, mode='markers', marker=dict(color='red', size=10))) fig.show() |
In this example, we have used the mode parameter to set the plot type as markers and customize the marker’s color and size.
Axis Labels and Titles
You can also add labels and titles to the axes of your plots. Let’s modify the previous bar chart example to include axis labels and a plot title:
|
1 2 3 4 5 6 7 8 9 10 11 12 |
import plotly.graph_objects as go categories = ['Category A', 'Category B', 'Category C'] values = [20, 30, 25] fig = go.Figure(data=go.Bar(x=categories, y=values)) fig.update_layout( xaxis_title="Categories", yaxis_title="Values", title="Bar Chart Example" ) fig.show() |
In this example, we have used the update_layout() method to set the x-axis title, y-axis title, and the plot title.
Adding Plotly Tooltips
Tooltips provide additional information when hovering over data points. Let’s modify the previous line plot example to include tooltips, In this example, we add the text parameter to provide tooltips for each data point. The hovertemplate parameter allows us to customize the tooltip content and format.
|
1 2 3 4 5 6 7 8 |
import plotly.graph_objects as go x = [1, 2, 3, 4, 5] y = [10, 12, 15, 18, 20] text = ['Point 1', 'Point 2', 'Point 3', 'Point 4', 'Point 5'] fig = go.Figure(data=go.Scatter(x=x, y=y, mode='markers', text=text, hovertemplate='(%{x}, %{y})<br>%{text}')) fig.show() |
Plotly Zooming and Panning
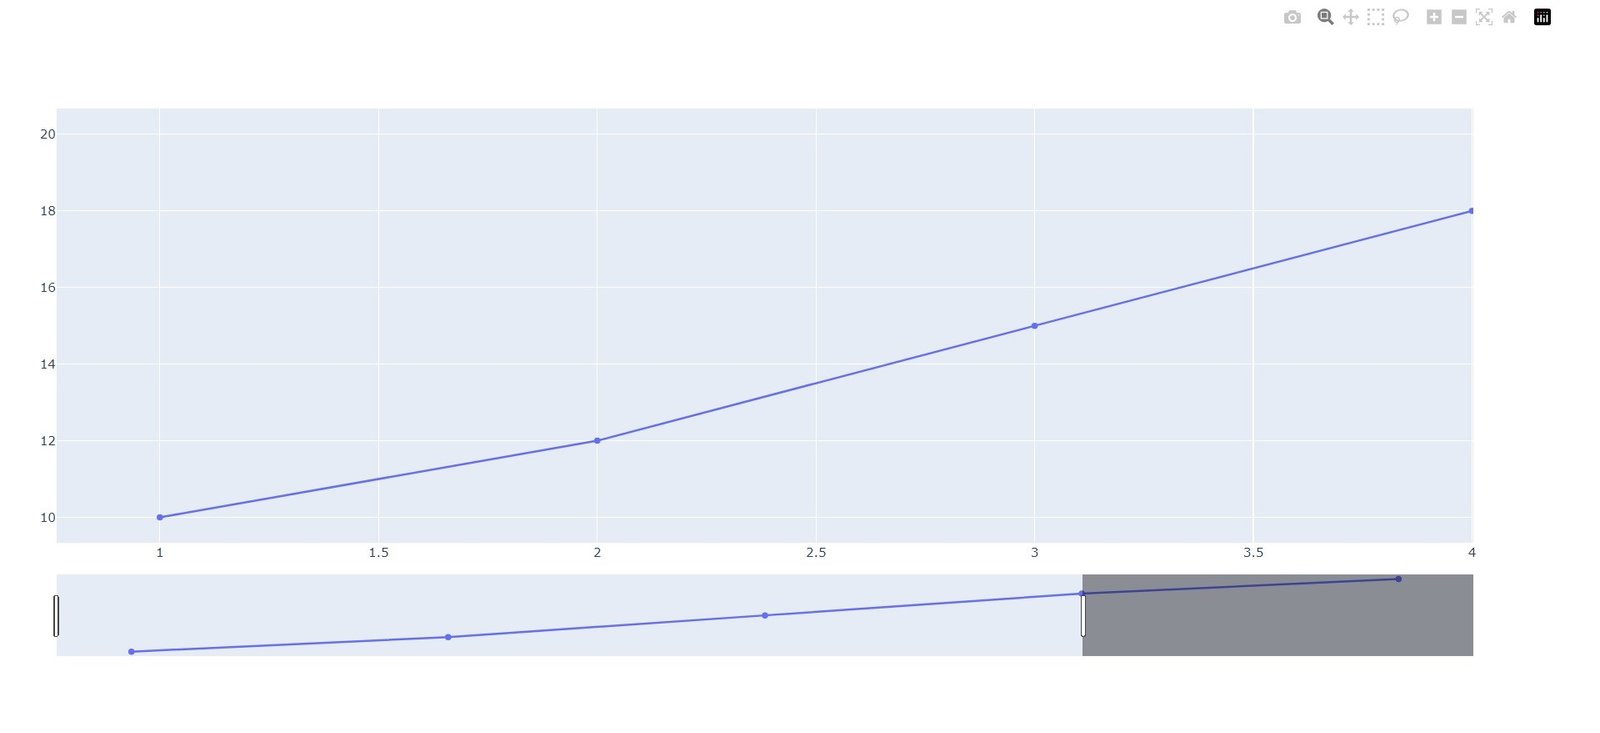
Plotly allows users to zoom and pan through plots. To enable zooming and panning, we can modify the layout.
|
1 2 3 4 5 6 7 8 9 10 11 12 13 14 15 16 17 |
import plotly.graph_objects as go x = [1, 2, 3, 4, 5] y = [10, 12, 15, 18, 20] fig = go.Figure(data=go.Scatter(x=x, y=y)) fig.update_layout( xaxis=dict( rangeslider=dict(visible=True), type="linear" ), yaxis=dict( autorange=True, type="linear" ), ) fig.show() |
In this example, we enable the range slider for the x-axis, and it allows users to zoom and pan along the x-axis. The autorange property is set to True for the y-axis, and it allows automatic scaling.
This will be the output

Plotly Subplots
For creating subplots, we can use the make_subplots() function. Let’s create a 2×2 grid of subplots, In this example, we have imported the make_subplots() function and specify the number of rows and columns for the grid. We then add traces (plots) to each grid cell using the add_trace() method.
|
1 2 3 4 5 6 7 8 9 10 11 |
from plotly.subplots import make_subplots import plotly.graph_objects as go fig = make_subplots(rows=2, cols=2) fig.add_trace(go.Scatter(x=[1, 2, 3], y=[4, 5, 6]), row=1, col=1) fig.add_trace(go.Bar(x=[1, 2, 3], y=[10, 15, 12]), row=1, col=2) fig.add_trace(go.Pie(labels=['A', 'B', 'C'], values=[5, 7, 10]), row=2, col=1) fig.add_trace(go.Box(x=[1, 2, 3, 4, 5], y=[2, 3, 5, 8, 13]), row=2, col=2) fig.show() |
Plotly Layouts
Plotly allows you to customize the overall layout of your plots. Let’s modify the previous example to include a custom layout:
|
1 2 3 4 5 6 7 8 9 10 11 12 13 14 15 16 17 18 19 20 21 |
import plotly.graph_objects as go fig = go.Figure() fig.add_trace(go.Scatter(x=[1, 2, 3], y=[4, 5, 6])) fig.add_trace(go.Bar(x=[1, 2, 3], y=[10, 15, 12])) fig.update_layout( title_text="Subplots Example", height=600, width=800, showlegend=False ) fig.show() fig2 = go.Figure(data=[go.Pie(labels=['A', 'B', 'C'], values=[5, 7, 10])]) fig2.show() fig3 = go.Figure(data=[go.Box(x=[1, 2, 3, 4, 5], y=[2, 3, 5, 8, 13])]) fig3.show() |
So in this tutorial, we explored the powerful features of Plotly for creating interactive data visualizations using Python. We covered basic plot types, customization options, interactive features, subplots, layouts, and sharing options.
Subscribe and Get Free Video Courses & Articles in your Email