In this Python Google Map article i want to show you How To Create GeoJSON Layer . basically
we are using gmaps library for this article . so gmaps is a Jupyter plugin for embedding Google
maps in Jupyter notebooks. It is designed to help visualize and interact with geographical data.
Check the previous articles on Python Google Map
1: Python Google Map Introduction With gmaps
2: Python Google Map Customizing Width & Height
3: Python Google Map How To Create Markers
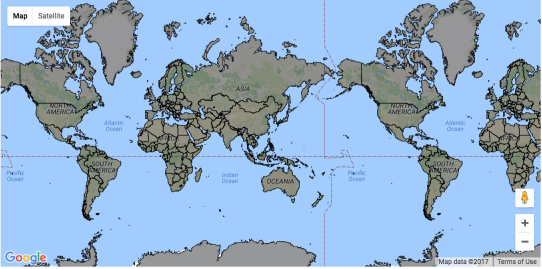
We can add GeoJSON to a map. this is very useful when we want to draw chloropleth maps.
you can either load data from your own GeoJSON file, or you can load one of the GeoJSON
geometries bundled with gmaps. We will create a map of the GINI coefficient (a measure of
inequality) for every country in the world.
So now this is the complete source code for this article
|
1 2 3 4 5 6 7 8 9 10 |
import gmaps import gmaps.geojson_geometries gmaps.configure(api_key='AIza...') countries_geojson = gmaps.geojson_geometries.load_geometry('countries') fig = gmaps.figure() gini_layer = gmaps.geojson_layer(countries_geojson) fig.add_layer(gini_layer) fig |
OK, in the above code you can see that first of all we have imported our gmaps library, also we
have imported the geojson from gmaps. after that you need to configure your api key. for more
information about creating api key you can check my first article on Python Google Map
Run the complete code and this will be the result

Also you can watch the complete video for this article
Subscribe and Get Free Video Courses & Articles in your Email