In this Python TKinter article i want to show How To Embed Matplotlib In TKinter Window. now first we want to talk about TKinter and also Matplotlib.
What is TKinter?
Tkinter is standard Python library, and it is used to build graphical user interfaces (GUIs). The name of Tkinter comes from Tk interface, and it provides Python bindings for Tk GUI toolkit. Tkinter is included with most Python installations, and you don’t need to install TKinter. using TKinter you can create desktop applications for different platforms, including Windows, macOS and Linux.
What Is Matplotlib ?
Matplotlib is a Python 2D plotting library which produces publication quality figures in a variety of hardcopy formats and interactive environments across platforms. Matplotlib can be used in Python scripts, the Python and IPython shells, the Jupyter notebook, web application servers, and four graphical user interface toolkits.
How to Install Matplotlib?
You can install matplotib using pip, open your command prompt or terminal and write this command.
|
1 |
pip install matplotlib |
How to Embed Matplotlib in TKinter Window?
Now let’s create an example of embedding matplotlib in TKinter, this is the complete code for this article
|
1 2 3 4 5 6 7 8 9 10 11 12 13 14 15 16 17 18 19 20 21 22 23 24 25 26 27 28 29 30 31 32 33 34 35 36 37 38 39 40 41 42 43 44 45 46 47 48 49 50 |
from tkinter import * from matplotlib.figure import Figure from matplotlib.backends.backend_tkagg import FigureCanvasTkAgg, NavigationToolbar2Tk class Root(Tk): def __init__(self): super(Root, self).__init__() # Set title of the window self.title("Codeloop - Tkinter Embedding Matplotlib") # Set window icon self.iconphoto(True, PhotoImage(file='codeloop.png')) # Call method to embed Matplotlib plot into Tkinter self.matplotCanvas() def matplotCanvas(self): # Create new Figure instance f = Figure(figsize=(5, 5), dpi=100) # Add subplot to the Figure a = f.add_subplot(111) # Plot some data on the subplot a.plot([1, 2, 3, 4, 5, 6, 7, 8], [5, 6, 1, 3, 8, 9, 3, 5]) # Create a Tkinter-compatible canvas from the Figure canvas = FigureCanvasTkAgg(f, self) # Draw the canvas canvas.draw() # Pack the canvas widget into the window canvas.get_tk_widget().pack(side=BOTTOM, fill=BOTH, expand=True) # Create a navigation toolbar for the canvas toolbar = NavigationToolbar2Tk(canvas, self) # Update the toolbar toolbar.update() # Pack the toolbar widget into the window canvas._tkcanvas.pack(side=TOP, fill=BOTH, expand=True) # Create an instance of the Root class root = Root() root.mainloop() |
Now let’s describe the code
We import necessary modules:
- tkinter: Provides GUI functionalities.
- Figure from matplotlib.figure: Represents a Matplotlib figure.
- FigureCanvasTkAgg and NavigationToolbar2Tk from matplotlib.backends.backend_tkagg: Provide tools for embedding Matplotlib plots into Tkinter applications.
|
1 2 3 |
from tkinter import * from matplotlib.figure import Figure from matplotlib.backends.backend_tkagg import FigureCanvasTkAgg, NavigationToolbar2Tk |
Root Class:
- We have defined a class Root that inherits from Tk, and it is the main window of our Tkinter application.
- In the __init__ method, we initialize the window by setting its title and icon, after that we call the matplotCanvas method.
|
1 2 3 4 |
class Root(Tk): def __init__(self): super(Root, self).__init__() ... |
MatplotCanvas Method:
- This method creates and embeds a Matplotlib plot into Tkinter window.
- It creates a Matplotlib figure (f) with specific size and dpi, also we add a subplot (a) to it, and plots some data on the subplot.
- After that it creates a Tkinter compatible canvas (canvas) from Matplotlib figure using FigureCanvasTkAgg.
- The canvas is drawn (canvas.draw()) and packed into the bottom side of the Tkinter window to fill the available space.
- Also a navigation toolbar (toolbar) is created using NavigationToolbar2Tk and packed into the top side of the window.
|
1 2 |
def matplotCanvas(self): ... |
Creating TKiner Application Instance and Running the Event Loop:
- An instance of the Root class is created.
- Tkinter event loop is started (root.mainloop()), which listens for events such as button clicks and updates the GUI accordingly.
|
1 2 |
root = Root() root.mainloop() |
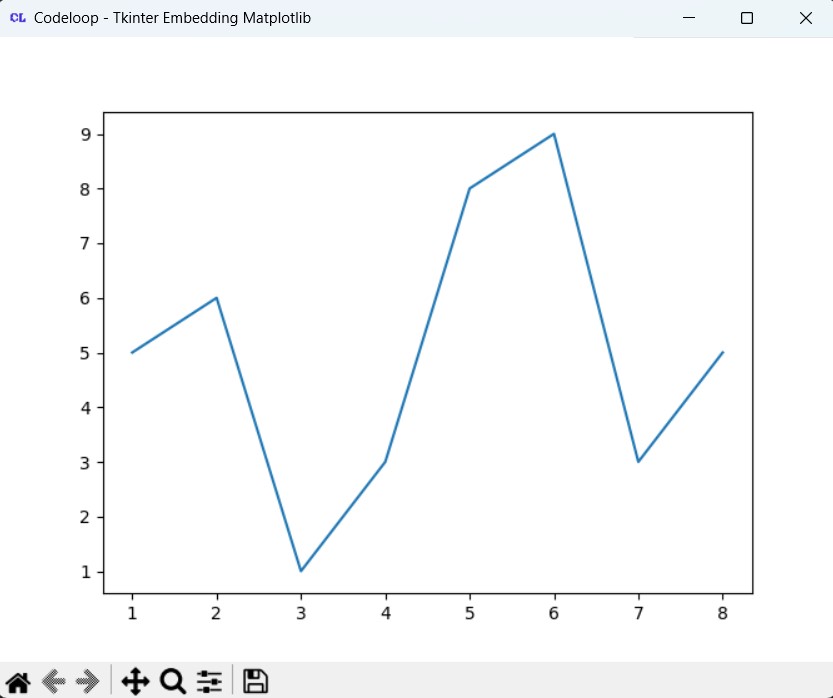
Run the complete code and this will be the result.

FAQs:
How to combine Matplotlib and Tkinter?
Combining Matplotlib and Tkinter allows you to create GUI applications with interactive plots. This is a basic example of how to do it:
|
1 2 3 4 5 6 7 8 9 10 11 12 13 14 15 16 17 18 19 20 21 22 23 24 25 |
import tkinter as tk from tkinter import ttk from matplotlib.figure import Figure from matplotlib.backends.backend_tkagg import FigureCanvasTkAgg # Create main window root = tk.Tk() root.title("Matplotlib Plot in Tkinter") # Create frame to contain the plot frame = ttk.Frame(root) frame.pack(padx=10, pady=10) # Create Matplotlib figure fig = Figure(figsize=(5, 4), dpi=100) ax = fig.add_subplot(111) ax.plot([1, 2, 3, 4], [10, 20, 25, 30]) # Create Matplotlib canvas widget canvas = FigureCanvasTkAgg(fig, master=frame) canvas.draw() canvas.get_tk_widget().pack() # Run Tkinter event loop root.mainloop() |
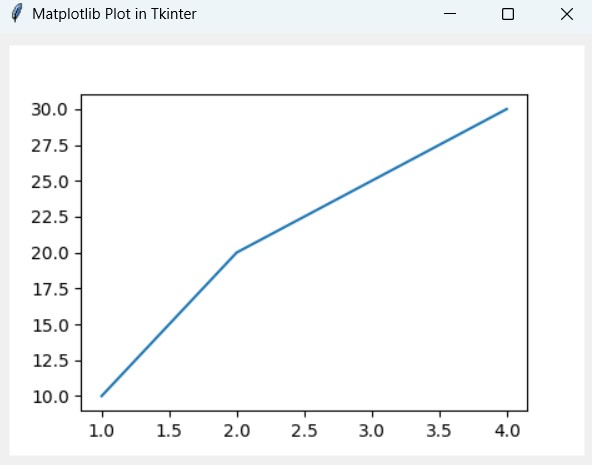
This will be the result

How do I show Matplotlib in Python?
For displaying Matplotlib plot in Python, you can use show() function provided by Matplotlib. This is a simple example:
|
1 2 3 4 5 6 7 8 9 10 11 |
import matplotlib.pyplot as plt # Create some data x = [1, 2, 3, 4] y = [10, 20, 25, 30] # Create a plot plt.plot(x, y) # Show the plot plt.show() |
Subscribe and Get Free Video Courses & Articles in your Email