In this article we want to talk about Python Plotly vs Matplotlib, so when it comes to data visualization in Python, then there are two popular library that we have in Python, we have Plotly and Matplotlib, these two libraries offer powerful tools for creating visual representations of data, but they have different approaches and features that make them unique. in this article we want to talk about the different between these two.
What is Plotly ?
Plotly is a comprehensive data visualization library that focuses on creating interactive and web based plots. It provides an easy way for generating visually appealing charts, graphs and dashboards. Plotly strength lies in its interactivity, and it allows users to explore data, zoom in and out, hover over points and add annotations.
What is Matplotlib ?
Matplotlib is one of the most popular and widely used data visualization libraries in Python. It offers different static, high-quality 2D and limited 3D plots. Matplotlib is known for its v flexibility, and it provides best control over every aspect of the plot. It is an excellent choice for creating publication ready visualizations with customization.
Let’s consider a practical example of visualizing historical stock prices over time to compare how Plotly and Matplotlib handle this scenario.
First of we need to import the necessary libraries:
|
1 2 3 |
import pandas as pd import plotly.express as px import matplotlib.pyplot as plt |
After that we need to load the data, we are going to use the Pandas library to load a sample stock price dataset in CSV format:
|
1 |
df = pd.read_csv('stock_prices.csv') |
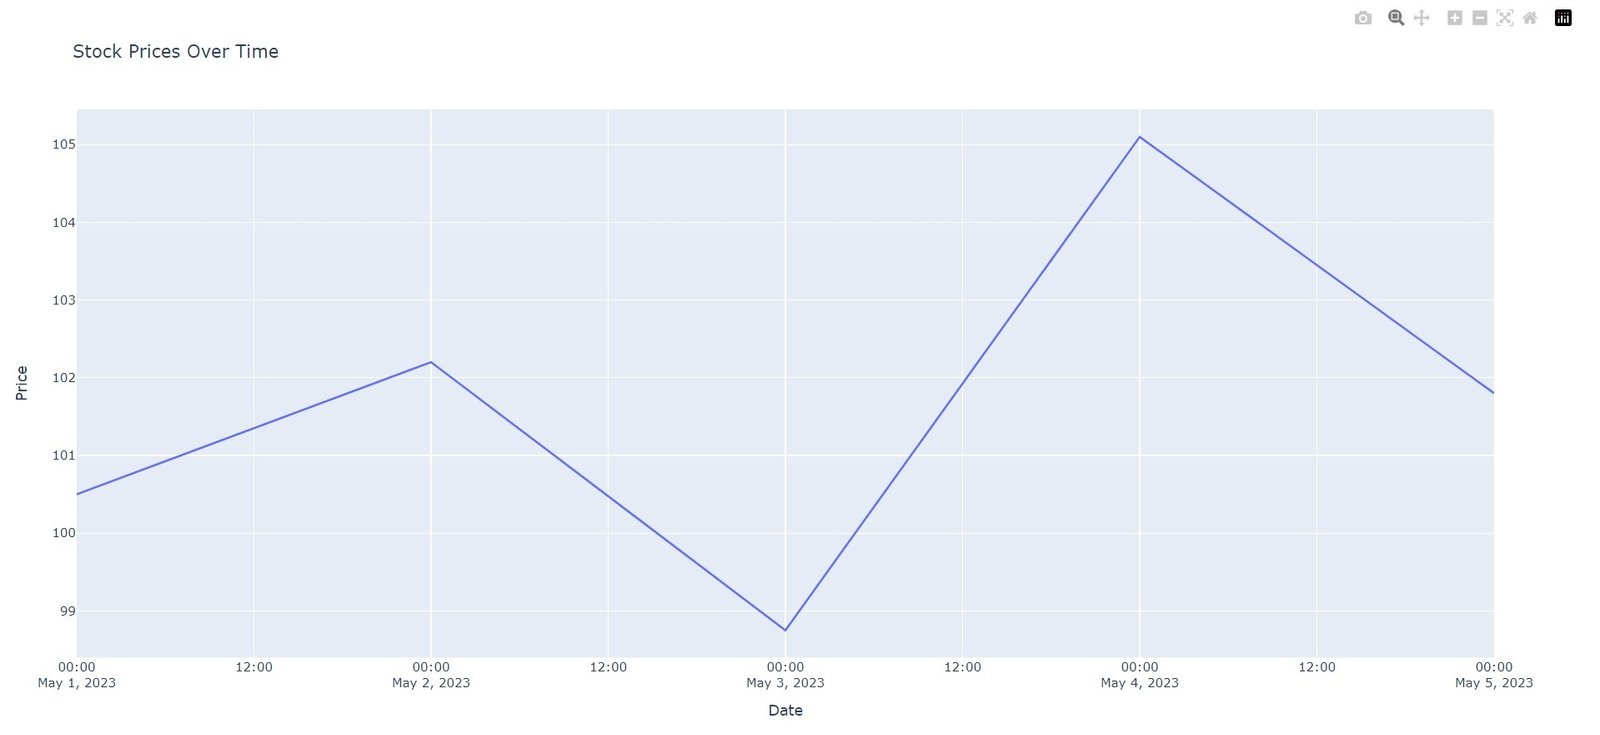
Now first let’s plot with plotly, for creating an interactive line plot with Plotly, we can use the plot function from the plotly.express module, Plotly generates an interactive plot that allows zooming, panning and hovering over the data points to display additional information.
|
1 2 |
fig = px.line(df, x='Date', y='Price', title='Stock Prices Over Time') fig.show() |
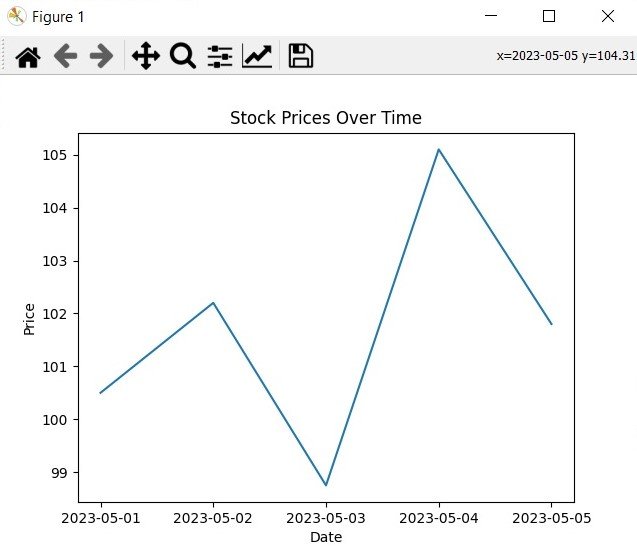
Now for creating a static line plot with Matplotlib, we can use the plot function from the pyplot module, Matplotlib produces a static plot that can be saved or used in publications. Matplotlib provides extensive customization options for axes, labels, colors, and more.
|
1 2 3 4 5 |
plt.plot(df['Date'], df['Price']) plt.title('Stock Prices Over Time') plt.xlabel('Date') plt.ylabel('Price') plt.show() |
Now this is the complete code for Plotly
|
1 2 3 4 5 6 7 8 9 10 |
import pandas as pd import plotly.express as px #Loading the Data df = pd.read_csv('stock_prices.csv') # Plotting with Plotly fig = px.line(df, x='Date', y='Price', title='Stock Prices Over Time') fig.show() |
This will be the output
This is the complete code for Matplotlib
|
1 2 3 4 5 6 7 8 9 10 11 12 13 |
import pandas as pd import matplotlib.pyplot as plt # Loading the Data df = pd.read_csv('stock_prices.csv') # Plotting with Matplotlib plt.plot(df['Date'], df['Price']) plt.title('Stock Prices Over Time') plt.xlabel('Date') plt.ylabel('Price') plt.show() |
And this will be the output
So we can say that both Plotly and Matplotlib are powerful visualization libraries in Python, each of them has its own strengths and weakness. Plotly is good for creating interactive and web based visualizations, and this is ideal for exploratory data analysis and creating interactive dashboards. Matplotlib on the other hand is a powerful library that offers best control over plot customization, and this is good for creating publication ready visualizations.
More Article on Python Plotly
- Python Plotly Tutorial
- Python Plotly for Scientific Visualization
- Python Plotly Geospatial Visualization
Subscribe and Get Free Video Courses & Articles in your Email