In this article we want to learn about Python Plotly Geospatial Visualization, In the world of data analysis and visualization, geospatial data presents unique challenges and opportunities. Python has different libraries and It provides powerful tools for creating interactive geospatial visualizations, in this article we want to talk that how we can use Python for geospatial visualization, so Plotly is a popular and powerful graphing library, it offers different visualization options, including support for geospatial data.
First of all we need to install this library and we can use pip for that.
|
1 |
pip install plotly |
Now we need to import our required modules from Plotly.
|
1 2 |
import plotly.graph_objects as go import plotly.io as pio |
For our example, let’s assume that we have a dataset, and it contains all information about earthquakes around the world. We will load this data, which typically includes latitude and longitude coordinates into Python. Also we need a shapefile (a common geospatial vector data format) that defines the borders of countries or regions to overlay on our map.
With the data loaded, we can now proceed to visualize the earthquakes on a map. This is an example of that:
|
1 2 3 4 5 6 7 8 9 10 11 12 13 14 15 16 17 18 19 20 21 22 23 24 25 26 27 28 29 30 31 32 33 |
# Create scattergeo trace for earthquake locations trace = go.Scattergeo( lon = earthquakes['longitude'], lat = earthquakes['latitude'], mode = 'markers', marker = dict( size = 5, color = 'red', line = dict( width = 0.5, color = 'rgba(0, 0, 0, 0.5)' ) ) ) # Create layout for the map layout = go.Layout( title = 'Global Earthquakes', showlegend = False, geo = dict( resolution = 110, showcoastlines = True, showframe = False, coastlinecolor = 'rgb(200,200,200)', projection_type = "natural earth" ) ) # Creat figure and add the trace fig = go.Figure(data=[trace], layout=layout) # Display the figure pio.show(fig) |
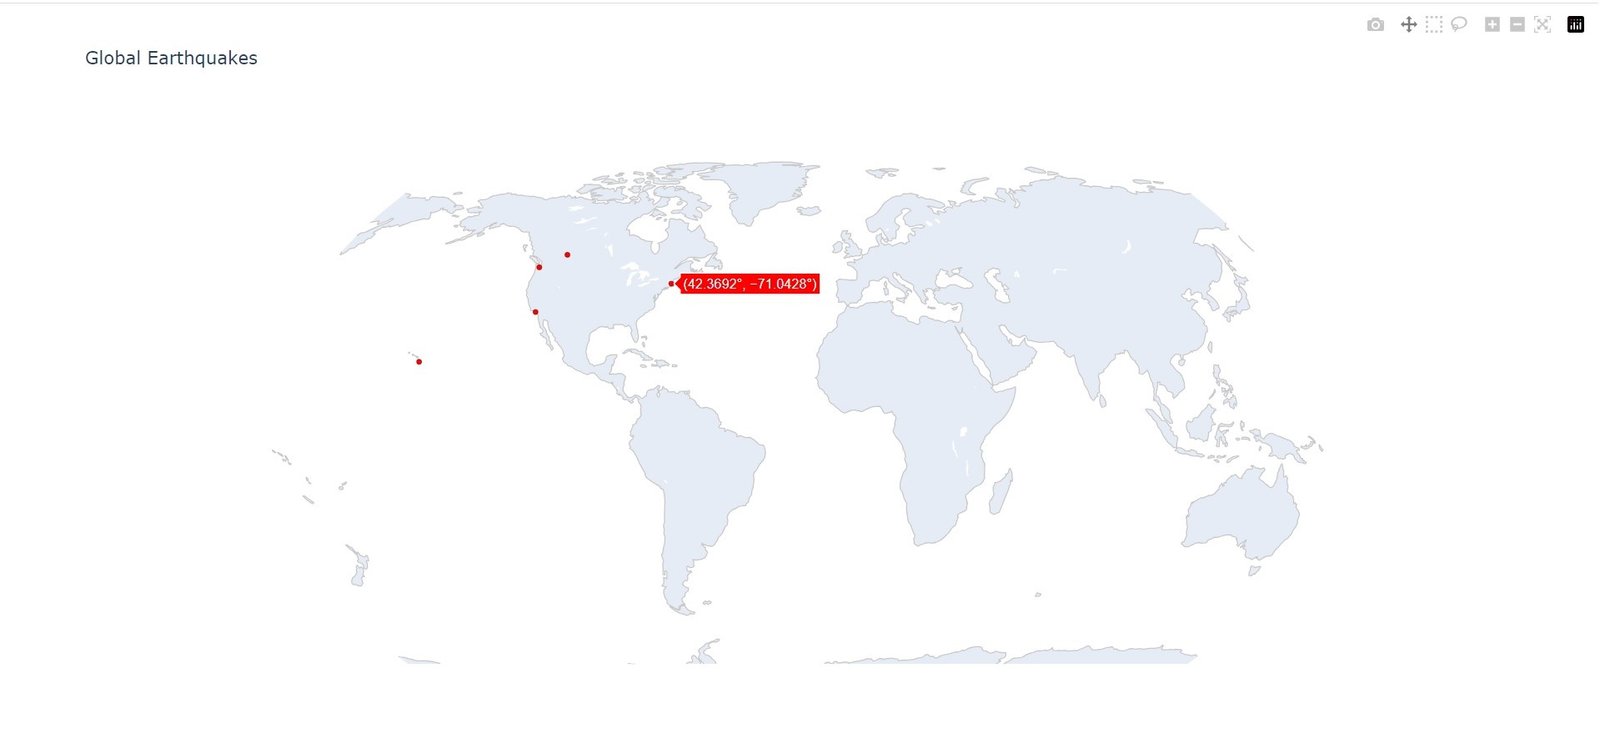
In this example, we have created scattergeo trace using the earthquake data, we have specified the longitude and latitude columns. We customized the marker style and defined the layout for the map. and lastly we creates a figure and display it using pio.show().
This is the complete code for this tutorial
|
1 2 3 4 5 6 7 8 9 10 11 12 13 14 15 16 17 18 19 20 21 22 23 24 25 26 27 28 29 30 31 32 33 34 35 36 37 38 39 40 |
import pandas as pd import plotly.graph_objects as go import plotly.io as pio # Load earthquake data earthquakes = pd.read_csv('earthquake_data.csv') # Creat scattergeo trace for earthquake locations trace = go.Scattergeo( lon = earthquakes['longitude'], lat = earthquakes['latitude'], mode = 'markers', marker = dict( size = 5, color = 'red', line = dict( width = 0.5, color = 'rgba(0, 0, 0, 0.5)' ) ) ) # Create a layout for the map layout = go.Layout( title = 'Global Earthquakes', showlegend = False, geo = dict( resolution = 110, showcoastlines = True, showframe = False, coastlinecolor = 'rgb(200,200,200)', projection_type = "natural earth" ) ) # Create the figure and add the trace fig = go.Figure(data=[trace], layout=layout) # Display the figure pio.show(fig) |
Run your code and this is the output
More Article on Python Plotly
Subscribe and Get Free Video Courses & Articles in your Email