In this Python Plotly tutorial we want to learn about Python Plotly Dashboards, as you know that data visualization is one of the important points for insights and making informed decisions. and also Python is one of the popular programming languages, that has a lot of libraries for data visualization, and one of them are Plotly.
What is Python Plotly ?
Python Plotly is an open-source Python library, and it is used for creating interactive and publication-quality visualizations. It offers different chart types, including line plots, scatter plots, bar charts, pie charts and 3D plots. With Plotly, you can easily customize your charts, add annotations, and create interactive dashboards for data exploration and presentation.
In this tutorial, we are going to also use Dash Framework.
What is Python Dash ?
Dash is Python framework for building web applications, and it is used on creating interactive data visualization dashboards. It is built on top of Flask, Plotly and other libraries, also it provides a simple and efficient way to create web-based applications with interactive components.
Now we need to install Dash and Plotly.
|
1 2 |
pip install plotly pip install dash |
This is the complete code for this article
|
1 2 3 4 5 6 7 8 9 10 11 12 13 14 15 16 17 18 19 20 21 22 23 24 25 26 27 28 29 30 31 32 33 34 35 36 37 38 |
import plotly.express as px from dash import Dash, dcc, html from dash.dependencies import Input, Output # Create sample data data = px.data.iris() # Create a Dash app app = Dash(__name__) # Define the layout of the dashboard app.layout = html.Div([ html.H1("My Plotly Dashboard"), dcc.Graph(id='graph'), dcc.Dropdown( id='dropdown', options=[ {'label': 'Sepal Length', 'value': 'sepal_length'}, {'label': 'Sepal Width', 'value': 'sepal_width'}, {'label': 'Petal Length', 'value': 'petal_length'}, {'label': 'Petal Width', 'value': 'petal_width'} ], value='sepal_length' ) ]) # Create callback function to update the chart based on user input @app.callback( Output('graph', 'figure'), [Input('dropdown', 'value')] ) def update_chart(selected_value): fig = px.scatter(data, x=selected_value, y='species', color='species') return fig # Run the app if __name__ == '__main__': app.run_server(debug=True) |
In the above code first we have imported the required libraries.
|
1 2 3 |
import plotly.express as px from dash import Dash, dcc, html from dash.dependencies import Input, Output |
The line data = px.data.iris() creates a sample dataset using the Iris dataset from Plotly Express. This dataset will be used to generate the scatter plot.
|
1 |
data = px.data.iris() |
The Dash app is initialized with the line app = Dash(__name__).
|
1 |
app = Dash(__name__) |
The layout of the dashboard is defined using app.layout. It includes an HTML H1 element for the title, a dcc.Graph component with an id of ‘graph’ to display the scatter plot, and a dcc.Dropdown component with an id of dropdown to allow the user to select the x-axis variable for the scatter plot.
|
1 2 3 4 5 6 7 8 9 10 11 12 13 14 |
app.layout = html.Div([ html.H1("My Plotly Dashboard"), dcc.Graph(id='graph'), dcc.Dropdown( id='dropdown', options=[ {'label': 'Sepal Length', 'value': 'sepal_length'}, {'label': 'Sepal Width', 'value': 'sepal_width'}, {'label': 'Petal Length', 'value': 'petal_length'}, {'label': 'Petal Width', 'value': 'petal_width'} ], value='sepal_length' ) ]) |
@app.callback decorator is used to create a callback function named update_chart. It takes the selected value from the dropdown as an input and outputs a figure to update the scatter plot.
|
1 2 3 4 |
@app.callback( Output('graph', 'figure'), [Input('dropdown', 'value')] ) |
Inside the update_chart function, a scatter plot is created using px.scatter. x parameter is set to the selected value from the dropdown, y is set to species and color is set to species as well. This creates a scatter plot with the x-axis representing the selected variable, the y-axis representing the species and the points colored by species.
|
1 2 3 |
def update_chart(selected_value): fig = px.scatter(data, x=selected_value, y='species', color='species') return fig |
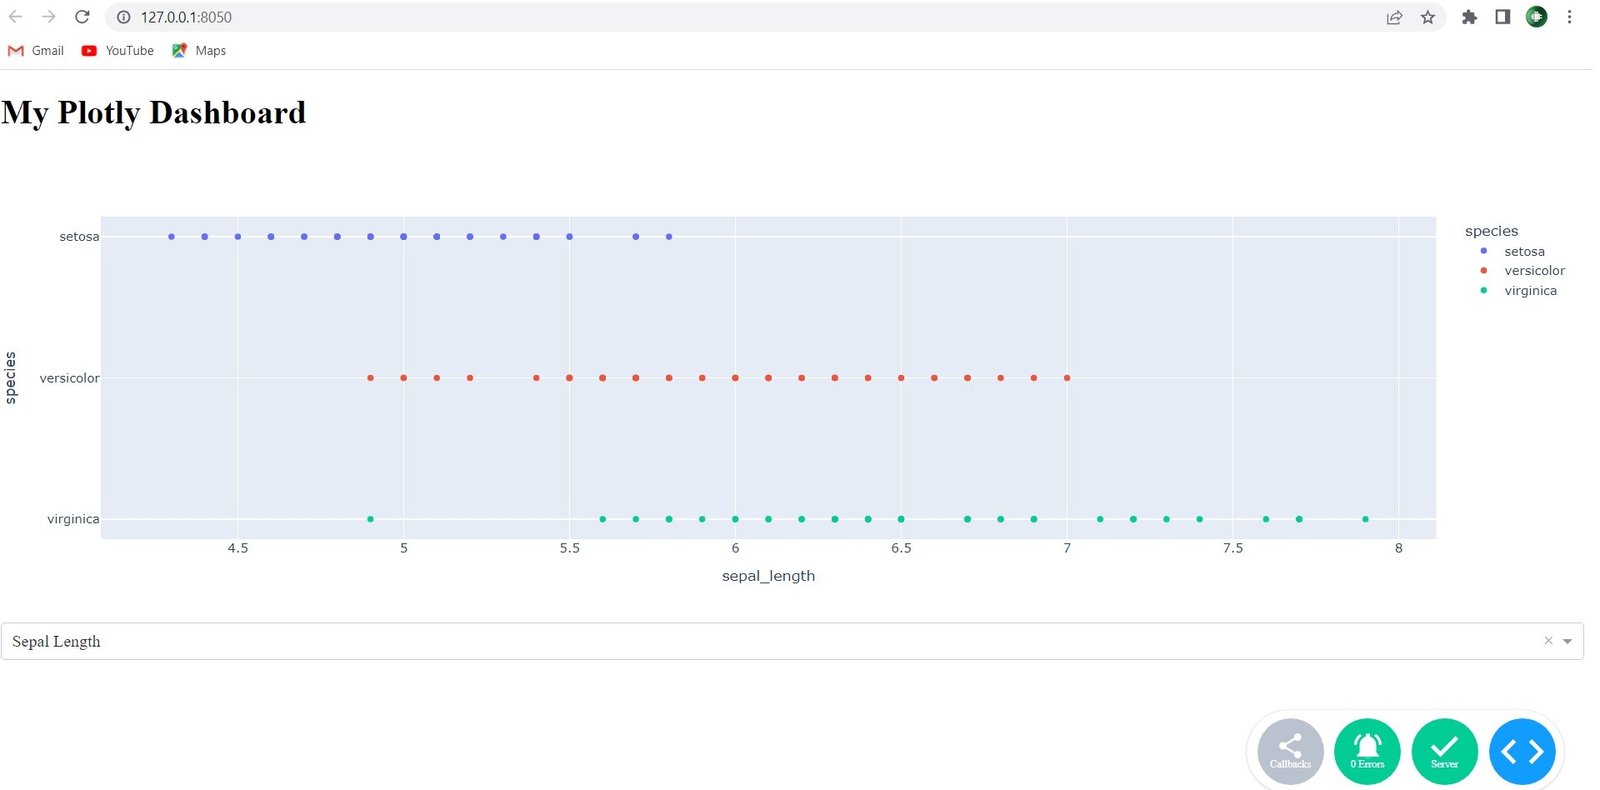
Run the code and this will be the output
More Articles on Python Plotly
- Python Plotly Tutorial
- Python Plotly for Scientific Visualization
- Python Plotly Geospatial Visualization
- Python Plotly vs Matplotlib
- How to Create Scatter Plot in Plotly
- How to Create 3D Plots in Python Plotly
- How to Create PieCharts in Python Plotly
- How to Create BarChart in Python Plotly
Subscribe and Get Free Video Courses & Articles in your Email