In this tutorial we want to learn about Python Plotly Charts, in the world of data visualization Python is one of the best programming language, because it has a lot of libraries to create nice and wonderful charts. among all these libraries plotly is the best choice, in this article we want to talk about the power of Plotly Charts and what can you do with that.
What is Plotly ?
Plotly is an open source graphing library that enables you to create interactive, publication quality charts and visualizations. With Plotly, you can build different chart types, including line charts, scatter plots, bar charts, pie charts and many more.
First of all we need to install plotly library and we can use pip for that.
|
1 |
pip install plotly |
This is the complete code for this article
|
1 2 3 4 5 6 7 8 9 10 11 12 13 14 15 16 17 18 |
import plotly.graph_objects as go dates = ['2023-05-25', '2023-05-26', '2023-05-27', '2023-05-28', '2023-05-29', '2023-05-30', '2023-05-31'] temperatures = [22, 23, 24, 25, 26, 24, 23] fig = go.Figure(data=go.Scatter(x=dates, y=temperatures)) fig.update_layout( title='Temperature Trend', xaxis_title='Date', yaxis_title='Temperature (°C)' ) fig.update_traces( hovertemplate='Temperature: %{y}°C<br>Date: %{x}' ) fig.show() |
So in the above code first we have imported our required modules.
|
1 |
import plotly.graph_objects as go |
Now let’s create a practical example and we want to create a Line Chart, suppose you have a dataset containing the daily temperature readings for a week. Your task is to create a line chart to visualize the temperature trend over time.
First, import the required libraries and define your data:
|
1 2 |
dates = ['2023-05-25', '2023-05-26', '2023-05-27', '2023-05-28', '2023-05-29', '2023-05-30', '2023-05-31'] temperatures = [22, 23, 24, 25, 26, 24, 23] |
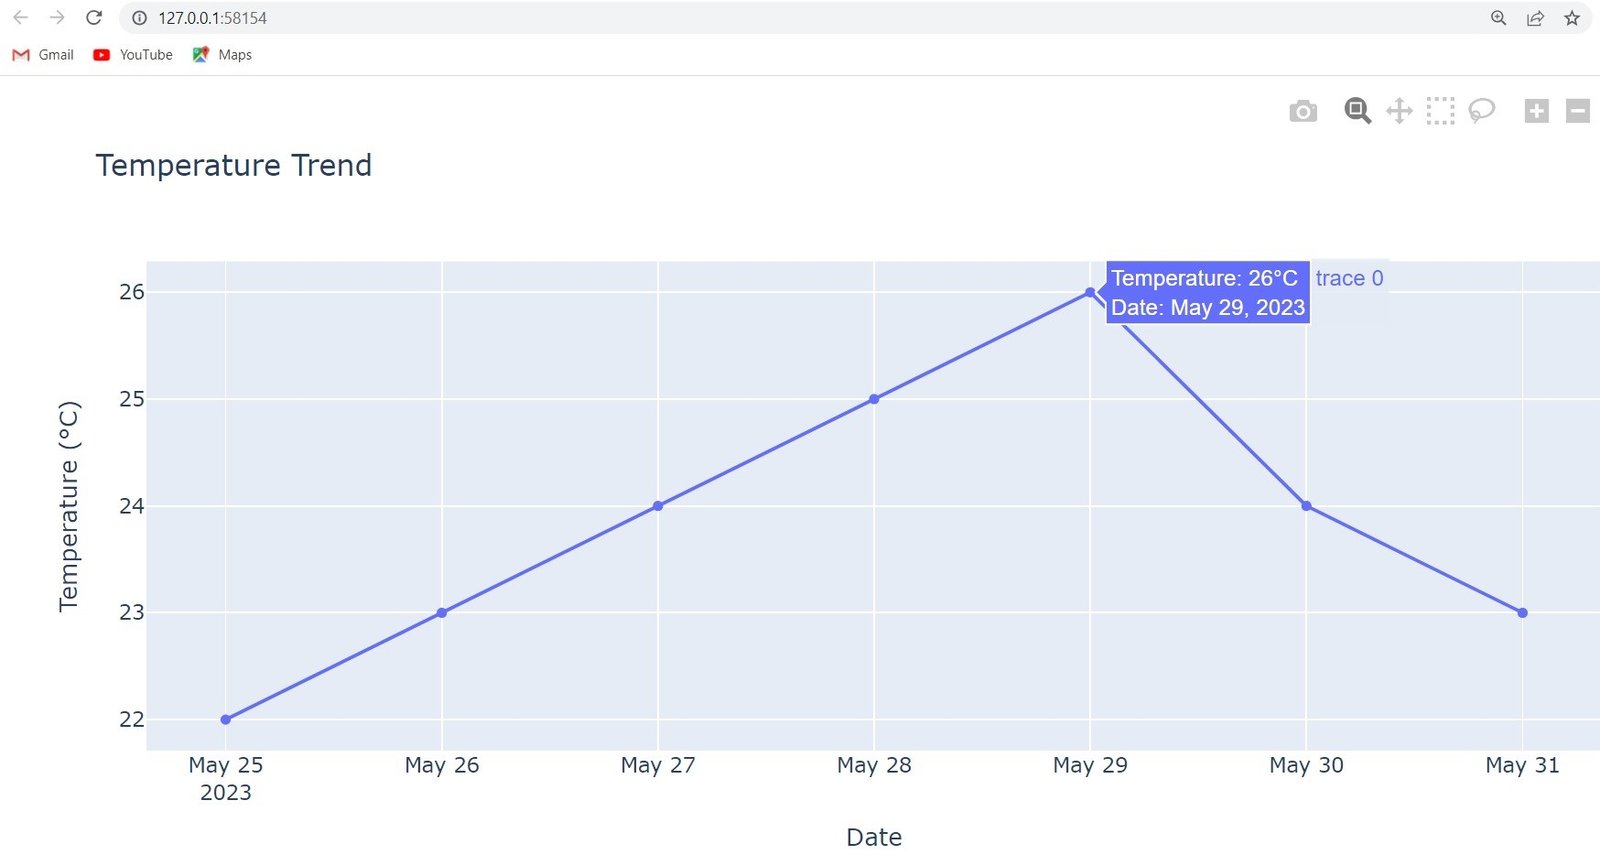
After that create line chart using Plotly, In this example, we have used go.Scatter class to define our line chart. x parameter represents the x-axis values (dates in this case), and the y parameter represents the y-axis values (temperatures in this case). The update_layout method is used to customize the chart’s title and axis labels, also we have used the update_traces method to customize the hovertemplate property. %{y} and %{x} placeholders within the hovertemplate string will be replaced with the corresponding y-axis (temperature) and x-axis (date) values when hovering over the data points.
|
1 2 3 4 5 6 7 8 9 10 11 |
fig.update_layout( title='Temperature Trend', xaxis_title='Date', yaxis_title='Temperature (°C)' ) fig.update_traces( hovertemplate='Temperature: %{y}°C<br>Date: %{x}' ) fig.show() |
Run the code and this will be the result

More Articles on Python Plotly
- Python Plotly Tutorial
- Python Plotly for Scientific Visualization
- Python Plotly Geospatial Visualization
- Python Plotly vs Matplotlib
- How to Create Scatter Plot in Plotly
- How to Create 3D Plots in Python Plotly
- How to Create PieCharts in Python Plotly
- How to Create BarChart in Python Plotly
- Python Plotly Dashboards
- Python Interactive Data Visualization with Plotly
Subscribe and Get Free Video Courses & Articles in your Email