In this Python Matplotlib article, we are going to learn Plotting Triangulation in Matplotlib . class matplotlib.tri. Triangulation (x, y, triangles=None, mask=None)[source] An unstructured triangular grid consisting of npoints points and ntri triangles. The triangles can either be specified by the user or automatically generated using a Delaunay triangulation. so when you are dealing with the spatial locations, you can use triangulation, also triangulation plots can be a convenient way to represent maps.
Also you can check More GUI Development Tutorials in the below link.
1: PyQt5 GUI Development Tutorials
2: TKinter GUI Development Tutorials
3: Pyside2 GUI Development Tutorials
4: Kivy GUI Development Tutorials
So now this is the complete code for Python Matplotlib – Plotting Triangulation.
|
1 2 3 4 5 6 7 8 9 10 11 12 13 14 |
import numpy as np import matplotlib.pyplot as plt import matplotlib.tri as tri #this is our raandom data for triangles data = np.random.rand(200, 2) #we have stored the triangles points triangles = tri.Triangulation(data[:,0], data[:,1]) #plotted the triangles plt.triplot(triangles) plt.show() |
OK first of all we have imported our libraries like Matlotlib, Numpy and especially matplotlib.tri. matplotlib.tri provides helper function to compute triangulation from the points.
In here we have created some random numbers, for creating of the random numbers we have used Numpy library
|
1 |
data = np.random.rand(200, 2) |
Also in this code we have computed the triangles and stored that in a triangles variable, because we will use this data in our plot.
|
1 |
triangles = tri.Triangulation(data[:,0], data[:,1]) |
And in here we have simply used plt.triplot() for plotting of the triangles.
|
1 |
plt.triplot(triangles) |
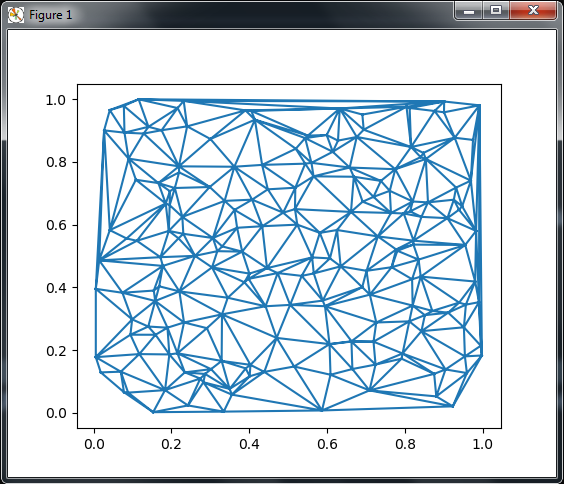
Now if you run the complete code this will be the result.
Subscribe and Get Free Video Courses & Articles in your Email