This is our seventh article in Python Matplotlib, in this article we are going to learn about Matplotlib Plotting BoxPlot. so in descriptive statistics, a box plot or boxplot is a method for graphically depicting groups of numerical data through their quartiles. Box plots may also have lines extending from the boxes indicating variability outside the upper and lower quartiles, hence the terms box-and-whisker plot and box-and-whisker diagram. also Boxplot allows you to compare distributions of values by conveniently showing the median, quartiles, maximum, and minimum of a set of values.
Matplotlib Tutorials For Beginners
1: Matplotlib Introduction & Installation
2: Matplotlib Plotting Multiple Curves
3: Matplotlib Plotting Scatter (Points)
4: Matplotlib Plotting BarChart
5: Matplotlib Plotting PieChart
6: Matplotlib Plotting Histogram
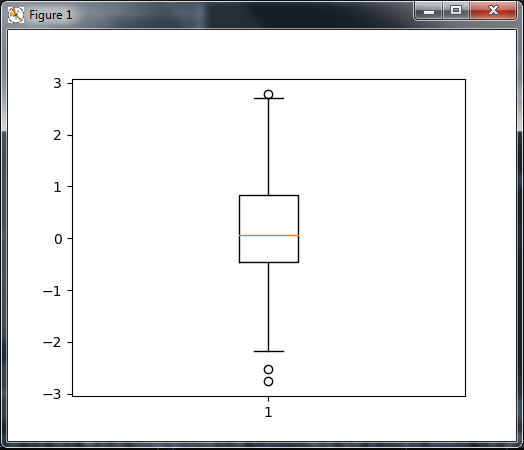
So now this is the simple code for plotting boxplot.
|
1 2 3 4 5 6 7 8 9 10 |
import numpy as np import matplotlib.pyplot as plt #our data data = np.random.randn(200) #plot the data plt.boxplot(data) plt.show() |
In the above code we have just imported our Matplotlib library, and after that we have created a random number, at the end we have plotted the boxplot. A boxplot will appear that represents the samples we drew from the random distribution. Since the code uses a randomly generated dataset, the resulting figure will change slightly every time the script is run. also The plot.boxplot() function takes a set of values and computes the mean, median, and other statistical quantities on its own.
If you run the code this will be result
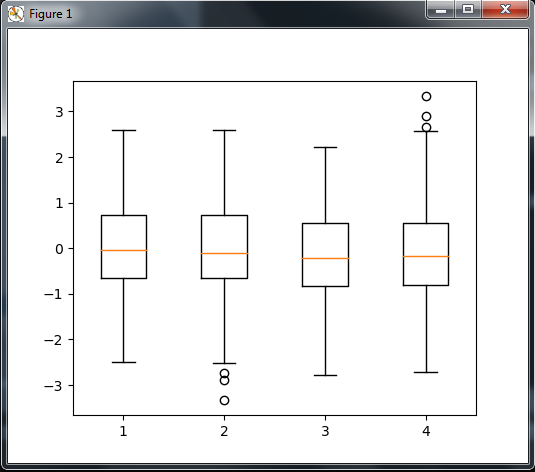
Also you can show more than one boxplot in a single graph, we can draw several boxplots with just one single call to pyplot.boxplot() as follows.
|
1 2 3 4 5 6 7 8 9 10 11 |
import numpy as np import matplotlib.pyplot as plt #our data data = np.random.randn(200,4) #plot the data plt.boxplot(data) plt.show() |
The pyplot.boxplot() function accepts a list of lists as the input, rendering a boxplot for each sublist.
So if you run the code this will be the result.
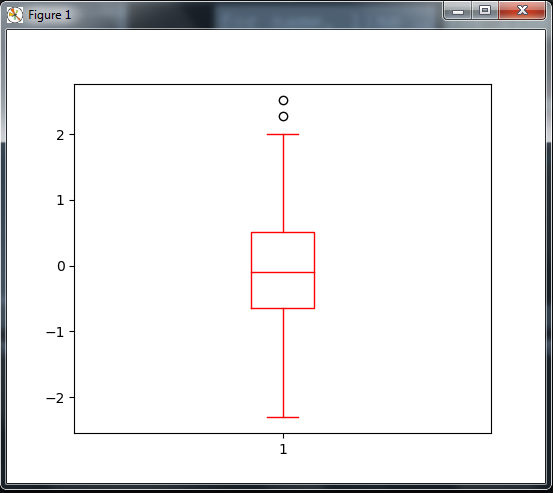
Customizing Colors for BoxPlot
Also you can customize the colors for boxplot, so in this code a boxplot appears totally red and a little bit ticker than it should be.
|
1 2 3 4 5 6 7 8 9 10 11 12 13 14 15 16 17 18 19 20 21 |
import numpy as np import matplotlib.pyplot as plt #our data data = np.random.randn(200) #plotting the data box_plot = plt.boxplot(data) #iterating over the daa for name, line_list in box_plot.items(): for line in line_list: line.set_color('r') #showing the graph plt.show() |
In the above code Plotting functions returns a dictionary. The key of the dictionary is the name of the graphical elements. In the case of a boxplot, such elements will be medians, fiers, whiskers, boxes, and caps. The value associated with each of those keys is a list of low-level graphic primitives lines, shapes, and so on. In the script, we iterate every graphic primitive that is a part of the boxplot and set its color to red. The same method allows you to render boxplots with your own color schemes.
Now if you run the code this will be the result
Subscribe and Get Free Video Courses & Articles in your Email