This is our second tutorial on Python Matplotlib, in this tutorial we are going to learn about Matplotlib Drawing Multiple Curves, so in the first tutorial we had a simple introduction to Matplotlib, also we have learned how you can install Matplotlib and we have created a simple example.
Matplotlib Tutorials For Beginners
1: Matplotlib Introduction & Installation
So now this is the complete code for Python Matplotlib Drawing Multiple Curves
|
1 2 3 4 5 6 7 8 9 10 11 12 13 14 |
import numpy as np import matplotlib.pyplot as plt X = np.linspace(0, 4 * np.pi, 50) Ya = np.sin(X) Yb = np.cos(X) plt.plot(X, Ya) plt.plot(X, Yb) plt.show() |
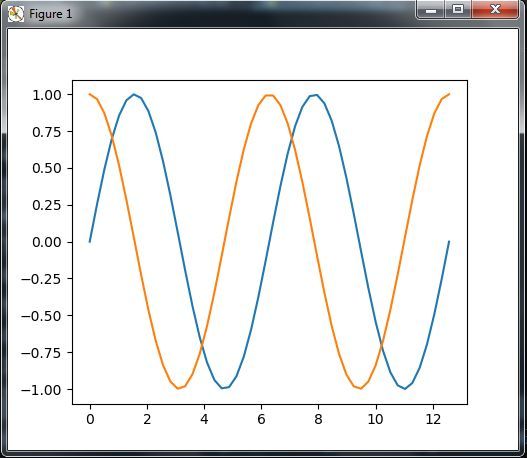
After runing of this code you will see that The two curves show up with a different color automatically picked up by matplotlib. We use one function call plt.plot() for one curve; thus, we have to call plt.plot() here twice. However, we still have to call plt.show() only once. The functions calls plt. plot(X, Ya) and plt.plot(X, Yb) can be seen as declarations of intentions. We want to link those two sets of points with a distinct curve for each. matplotlib will simply keep note of this intention but will not plot anything yet. The plt.show() curve, however, will signal that we want to plot what we have described so far.
If you run the code this will be the result

So now let’s plot a curve from a file data. i have created a txt file in my working directory at name of data.txt, but you can name it what ever you want. and this is the simple data for our file.
|
1 2 3 4 5 6 |
0 0 1 1 2 8 4 20 5 30 6 46 |
OK this is the code for plotting of the data from a file.
|
1 2 3 4 5 6 7 8 9 10 11 12 13 |
import matplotlib.pyplot as plt X, Y = [], [] for line in open('data.txt', 'r'): numbers = [float(s) for s in line.split()] X.append(numbers[0]) Y.append(numbers[1]) plt.plot(X, Y) plt.show() |
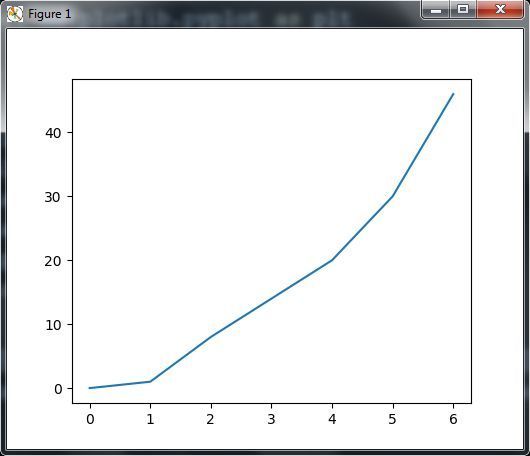
So in the above code first we have imported our matplotlib library, after that we have created two empty lists, and than we have used for loop for opening of our txt file and appending that data to the two lists. at the end we have plotted the data.
After run this will be the result

Subscribe and Get Free Video Courses & Articles in your Email