In this Python Matplotlib article we are going to learn about Matplotlib Adding Grids & Labels, also you can read my previous articles in Python Matplotlib in the below links.
Adding Grid
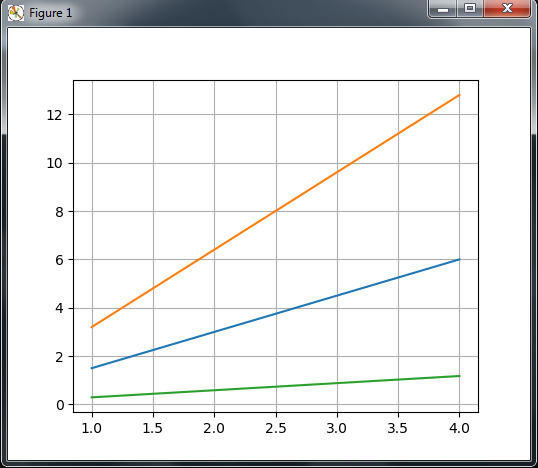
there are situations where having a reference system would improve the comprehension of the plot—for example with multiline plots. we can add a grid to the plot by calling the grid() function, it takes one parameter, a Boolean value, to enable (if True) or disable (if False) the grid.
So this is the code for creating grid in Matplotlib, basically we are going to create Grid in a line plot.
|
1 2 3 4 5 6 7 8 9 10 11 12 13 14 15 |
import matplotlib.pyplot as plt import numpy as np #our data in the range x = np.arange(1, 5) #plotting the data plt.plot(x, x*1.5, x, x*3.2, x, x/3.4) #enable the grid plt.grid(True) #showing the plot plt.show() |
If you run the code, this will be the result
Adding Labels
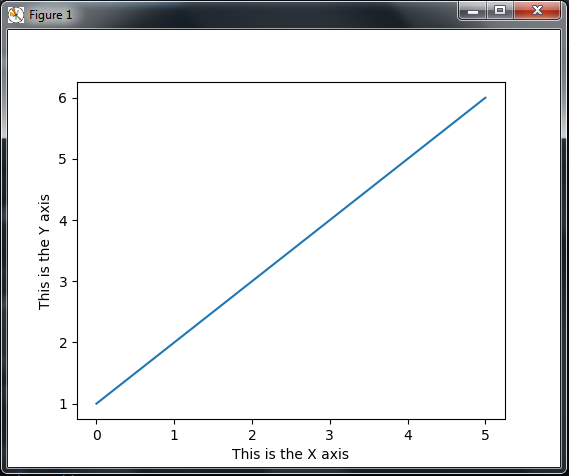
Now we are going to learn how to add labels in Matplotlib. you can see that in the following code we have created two labels for x and y axes.
|
1 2 3 4 5 6 7 8 9 10 11 12 13 14 15 |
import matplotlib.pyplot as plt #our data for plotting plt.plot([1,2,3,4,5,6]) #x axes label plt.xlabel('This is the X axis') #y axes label plt.ylabel('This is the Y axis') #showing the plot plt.show() |
Now if you run the code this will be the result.
Title and Legends
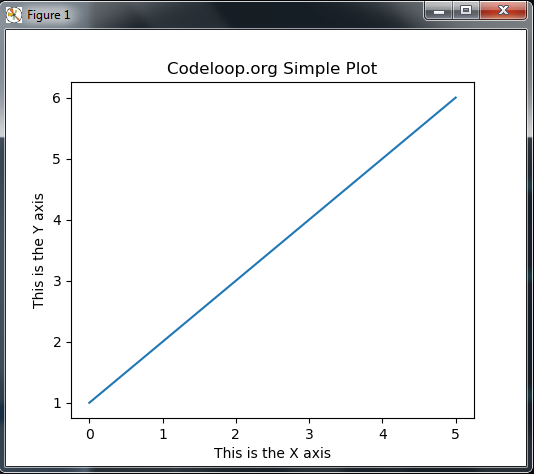
So now we are going to learn how you can create Title and Legends for your matplotlib. you can use plt.title() for giving title.
|
1 2 3 4 5 6 7 8 9 10 11 12 13 14 15 16 17 18 19 |
import matplotlib.pyplot as plt #our data for plotting plt.plot([1,2,3,4,5,6]) #x axes label plt.xlabel('This is the X axis') #y axes label plt.ylabel('This is the Y axis') #title plt.title('Codeloop.org Simple Plot') #showing the plot plt.show() |
If you run the code this will be the result, and you can see that we have a title at the top.
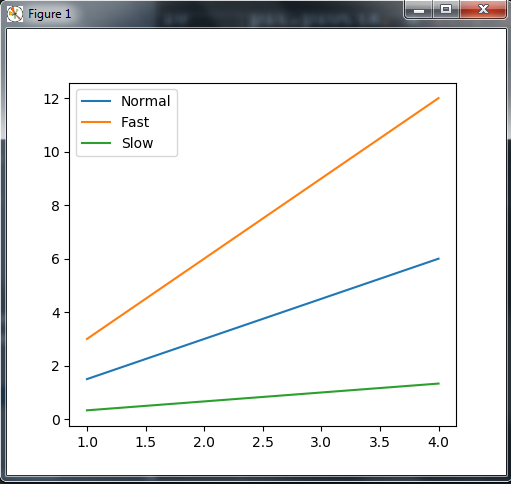
So now let’s create the legend, Legends are used to explain what each line means in the current figure. Let’s take the multi line plot example .
|
1 2 3 4 5 6 7 8 9 10 11 12 13 14 15 16 17 18 19 20 21 22 23 24 |
import matplotlib.pyplot as plt import numpy as np #creating range of value x = np.arange(1, 5) #plotting the first data plt.plot(x, x*1.5, label='Normal') #plotting the second data plt.plot(x, x*3.0, label='Fast') #plotting the third data plt.plot(x, x / 3.0, label='Slow') #This is our legend plt.legend() #showing the plot plt.show() |
We added an extra keyword argument, label, to the plot() call. This keyword argument provides the information required to compose the text of the legend. Since keyword arguments must come after non-keyword arguments, we have to plot each line in separate plot() calls that include the label argument. Now, calling the legend() function with no argument will show that information in the legend box.
Now if you run the code, you can see the legends in the plot.
Matplotlib Tutorials For Beginners
1: Matplotlib Introduction & Installation
2: Matplotlib Plotting Multiple Curves
3: Matplotlib Plotting Scatter (Points)
4: Matplotlib Plotting BarChart
5: Matplotlib Plotting PieChart
6: Matplotlib Plotting Histogram
7: Matplotlib Plotting BoxPlot
Subscribe and Get Free Video Courses & Articles in your Email