In this Python Kivy tutorial we want to learn how to Create Charts in Kivy, so first of all let’s talk about Kivy and also about installation of Python Kivy.
What is Kivy?
Kivy is an open-source Python library, we can use Kivy for developing multi-touch applications. It is cross-platform and works on Windows, macOS, Linux, Android, iOS, and Raspberry Pi. Kivy is using for providing natural user interface for different types of applications, particularly those involving touch, gestures and other input methods.
Kivy Installation
For working with example of this tutorial, we need to install these dependencies, you can use pip for the installation.
|
1 2 |
pip install kivy kivy-garden matplotlib garden install matplotlib |
What is Kivy Garden?
Kivy Garden is an extension of the Kivy framework, and it provides additional widgets and functionalities that are not included in the main Kivy library. It serves as a collection of community contributed widgets and tools that enhance the capabilities of Kivy, Using that you can create more sophisticated and customized applications.
This is the complete code for this article
|
1 2 3 4 5 6 7 8 9 10 11 12 13 14 15 16 17 18 19 20 21 22 23 24 25 26 27 28 29 30 31 32 33 34 35 36 37 38 39 40 41 42 43 44 45 46 47 48 49 50 51 52 53 54 55 56 57 58 59 60 61 62 63 64 65 66 67 68 69 70 71 |
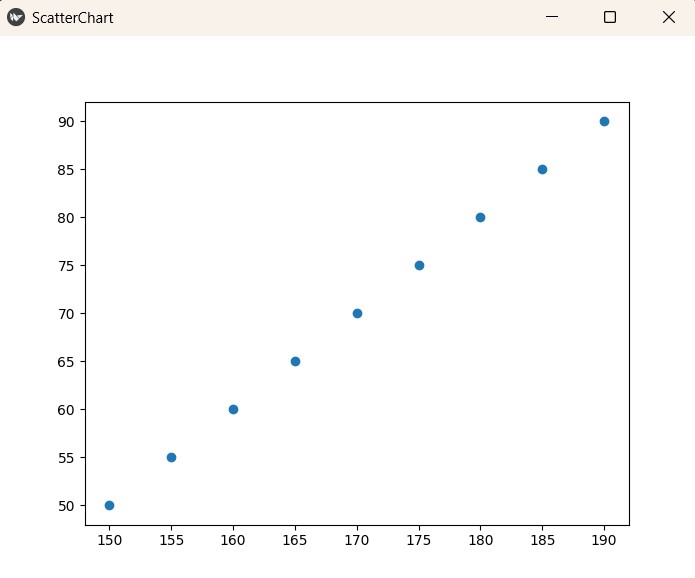
import kivy from kivy.app import App from kivy.uix.boxlayout import BoxLayout from kivy.garden.matplotlib.backend_kivyagg import FigureCanvasKivyAgg import matplotlib.pyplot as plt class CustomFigureCanvasKivyAgg(FigureCanvasKivyAgg): def _on_size_changed(self, instance, value): # Override to avoid calling resize_event self.figure.set_size_inches(self.size[0] / self.figure.dpi, self.size[1] / self.figure.dpi, forward=True) self.draw_idle() def resize_event(self, event=None): # Safe override for resize_event pass def motion_notify_event(self, x, y, guiEvent=None): # Safe override for motion_notify_event pass def enter_notify_event(self, guiEvent=None, xy=None): # Safe override for enter_notify_event pass def leave_notify_event(self, guiEvent=None): # Safe override for leave_notify_event pass def button_press_event(self, x, y, button, dblclick=False, guiEvent=None): # Safe override for button_press_event pass def button_release_event(self, x, y, button, guiEvent=None): # Safe override for button_release_event pass def scroll_event(self, x, y, step, guiEvent=None): # Safe override for scroll_event pass class ScatterChartApp(App): def build(self): # Create BoxLayout box_layout = BoxLayout(orientation='vertical') # Create Matplotlib FigureCanvasKivyAgg widget figure, ax = plt.subplots() self.canvas = CustomFigureCanvasKivyAgg(figure) # Bind the Kivy widget size change event to a resize method box_layout.bind(size=self._resize) # Add Matplotlib widget to the BoxLayout box_layout.add_widget(self.canvas) # Create Scatter Chart heights = [150, 155, 160, 165, 170, 175, 180, 185, 190] weights = [50, 55, 60, 65, 70, 75, 80, 85, 90] ax.scatter(heights, weights) return box_layout def _resize(self, instance, value): # Manually handle the resizing of the figure width, height = instance.size dpi = self.canvas.figure.get_dpi() self.canvas.figure.set_size_inches(width / dpi, height / dpi) self.canvas.figure.canvas.draw_idle() if __name__ == '__main__': ScatterChartApp().run() |
This code imports required modules, after that we define a custom subclass of FigureCanvasKivyAgg, and also Kivy application class called ScatterChartApp. Inside the application class, we create a BoxLayout and a Matplotlib FigureCanvasKivyAgg widget, then we bind resize event, adds the widget to the layout, and creates a scatter plot using Matplotlib. _resize method handles resizing of the figure. Finally, it runs the Kivy application.
Run the complete code and this will be the result
Subscribe and Get Free Video Courses & Articles in your Email