Python Google Map Customizing Width & Height – in the previous article we had
introduction to Python Google Map with gmaps, also we have created some examples of Google Map
in Python programming language, in this article we are going to talk about customizing width
and height of Google Map, also we are going to create heatmap.
Check the previous article on Python Google Map
1: Python Google Map Introduction With gmaps
So the layout of a map figure is controlled by passing a layout argument. This is a dictionary of
properties controlling how the widget is displayed.
|
1 2 3 4 5 6 7 8 9 10 11 12 |
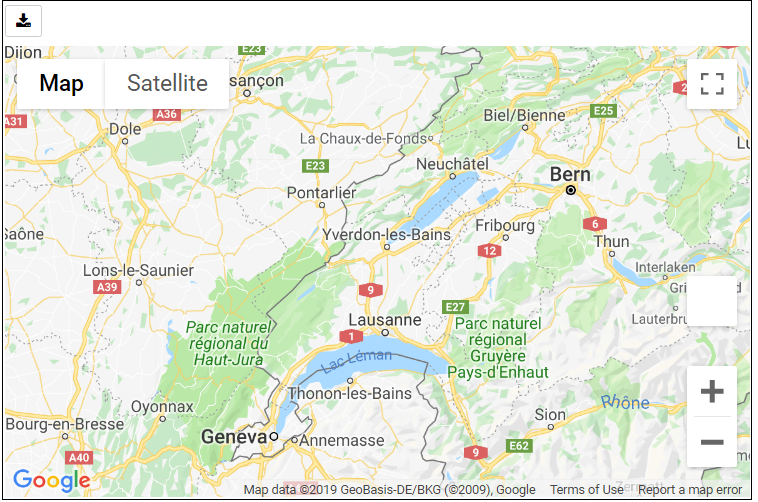
import gmaps gmaps.configure(api_key='AI...') figure_layout = { 'width': '600px', 'height': '400px', 'border': '1px solid black', 'padding': '1px' } gmaps.figure(layout=figure_layout) |
After runing the code this will be the result.

The parameters that you are likely to want to tweak are:
- width: controls the figure width. This should be a CSS dimension. For instance, 400px will create a figure that is 600 pixels wide, while 100% will create a figure that takes up the output cell’s entire width. The default width is 100%.
- height: controls the figure height. This should be a CSS dimension. The default height is 400px.
- border: Place a border around the figure. This should be a valid CSS border.
- padding: Gap between the figure and the border. This should be a valid CSS padding. You can either have a single dimension (e.g. 2px), or a quadruple indicating the padding width for each side (e.g. 1px 2px 1px 2px). This is 0 by default.
- margin: Gap between the border and the figure container. This should be a valid CSS margin. This is 0 by
default.
Creating Heatmaps
Heatmaps are a good way of getting a sense of the density and clusters of geographical events.
They are a powerful tool for making sense of larger datasets. We will use a dataset recording all
instances of political violence that occurred in Africa between 1997 and 2015. The dataset comes
from the Armed Conflict Location and Event Data Project. This dataset contains about 110,000
rows.
|
1 2 3 4 5 6 7 8 9 10 11 |
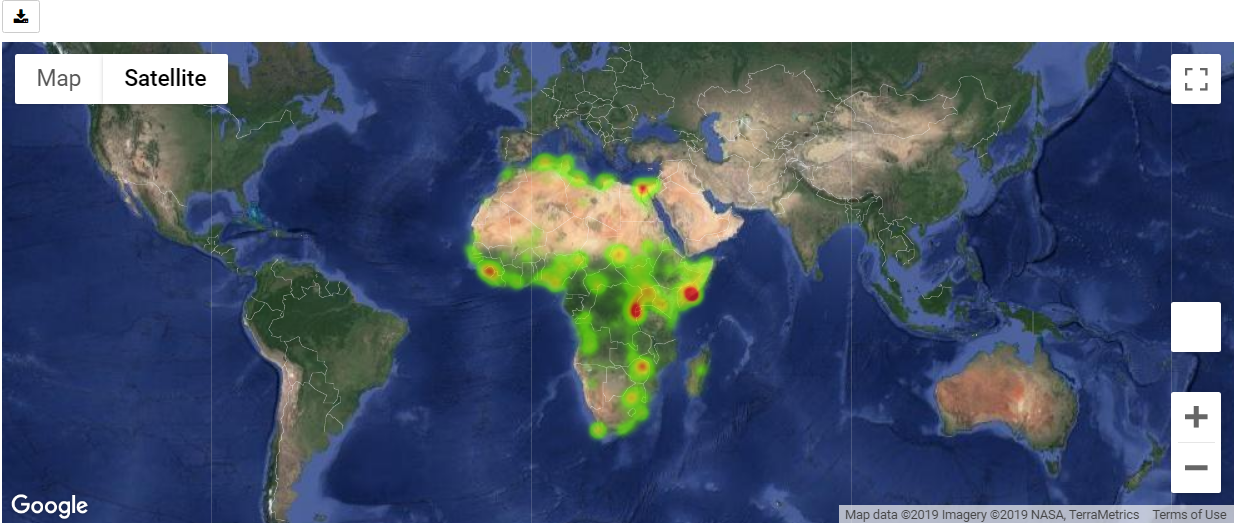
import gmaps import gmaps.datasets gmaps.configure(api_key='AIza...') locations = gmaps.datasets.load_dataset_as_df('acled_africa') fig = gmaps.figure(map_type='HYBRID') heatmap_layer = gmaps.heatmap_layer(locations) fig.add_layer(heatmap_layer) fig |
Run the complete code and this will be the result.

Preventing Dissipation on Zoom
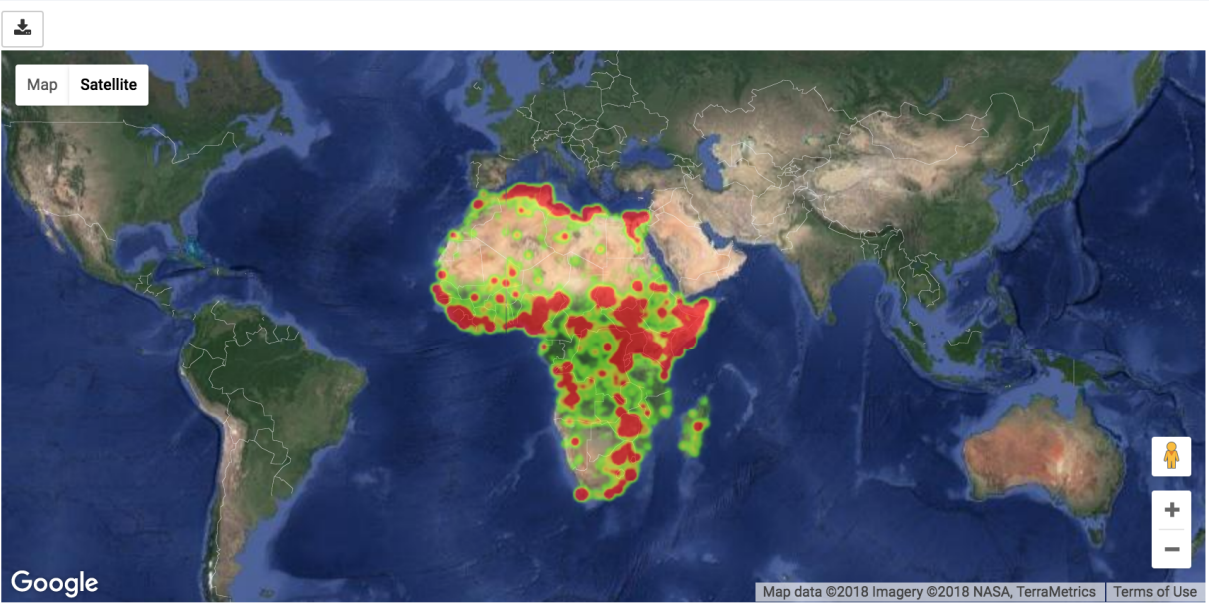
If you zoom in sufficiently, you will notice that individual points disappear. You can prevent this
from happening by controlling the max_intensity setting. This caps off the maximum peak intensity.
It is useful if your data is strongly peaked. This settings is None by default, which implies no
capping. Typically, when setting the maximum intensity, you also want to set the point_radius
setting to a fairly low value. The only good way to find reasonable values for these settings is to
tweak them until you have a map that you are happy with.:
|
1 2 |
heatmap_layer.max_intensity = 100 heatmap_layer.point_radius = 5 |
To avoid re-drawing the whole map every time you tweak these settings, you may want to set them
in another notebook cell:

Google maps also exposes a dissipating option, which is true by default. If this is true, the radius of
influence of each point is tied to the zoom level: as you zoom out, a given point covers more physical
kilometres. If you set it to false, the physical radius covered by each point stays fixed. Your points
will therefore either be tiny at high zoom levels or large at low zoom levels.
Setting Color Gradient and Opacity For Map
You can set the color gradient of the map by passing in a list of colors. Google maps will interpolate
linearly between those colors. You can represent a color as a string denoting the color (the colors
allowed by this).
|
1 2 3 4 5 |
heatmap_layer.gradient = [ 'white', 'silver', 'gray' ] |
If you need more flexibility, you can represent colours as an RGB triple or an RGBA quadruple.
|
1 2 3 4 5 |
heatmap_layer.gradient = [ (200, 200, 200, 0.6), (100, 100, 100, 0.3), (50, 50, 50, 0.3) ] |
Also you can watch the complete video for this article
Subscribe and Get Free Video Courses & Articles in your Email