In this PyQt5 article iam going to show you How to Embed Matplotlib Graph, so
before starting our main topic if your interested in Python GUI Development with different
libraries , you can check the below links.
Also you can check more Python GUI articles in the below links
1: Kivy GUI Development Tutorials
2: Python TKinter GUI Development
5: PyQt5 GUI Development Course
What is Matplotlib ?
Matplotlib is a Python 2D plotting library which produces publication quality figures in a variety of hardcopy formats and interactive environments across platforms. Matplotlib can be used in Python scripts, the Python and IPython shells, the Jupyter notebook, web application servers, and four graphical user interface toolkits.
Matplotlib tries to make easy things easy and hard things possible. You can generate plots, histograms, power spectra, bar charts, errorcharts, scatterplots, etc., with just a few lines of code. For examples, see the sample plots and thumbnail gallery.
For simple plotting the pyplot module provides a MATLAB-like interface, particularly when combined with IPython. For the power user, you have full control of line styles, font properties, axes properties, etc, via an object oriented interface or via a set of functions familiar to MATLAB users.
Installation
You can simple install matplotlib by using pip install matplotlib, or for more information about installation you can check the Installation Instruction.
What is PyQt5 ?
Qt is set of cross-platform C++ libraries that implement high-level APIs for accessing many aspects of modern desktop and mobile systems. These include location and positioning services, multimedia, NFC and Bluetooth connectivity, a Chromium based web browser, as well as traditional UI development.
PyQt5 is a comprehensive set of Python bindings for Qt v5. It is implemented as more than 35 extension modules and enables Python to be used as an alternative application development language to C++ on all supported platforms including iOS and Android.
PyQt5 may also be embedded in C++ based applications to allow users of those applications to configure or enhance the functionality of those applications.
Installation
The GPL version of PyQt5 can be installed from PyPI:
|
1 |
pip install PyQt5 |
The wheels include a copy of the required parts of the LGPL version of Qt.
pip will also build and install the bindings from the sdist package but Qt’s qmake tool
must be on PATH.
The sip-install tool will also install the bindings from the sdist package but will allow
you to configure many aspects of the installation.
Now this is the complete code for How to Embed Matplotlib Graph in PyQt5.
|
1 2 3 4 5 6 7 8 9 10 11 12 13 14 15 16 17 18 19 20 21 22 23 24 25 26 27 28 29 30 31 32 33 34 35 36 37 38 39 40 41 42 43 44 45 46 47 48 49 50 51 52 53 54 55 56 57 58 59 60 |
from PyQt5.QtWidgets import QMainWindow, QApplication, QPushButton import sys from matplotlib.backends.backend_qt5agg import FigureCanvasQTAgg as FigureCanvas from matplotlib.figure import Figure import numpy as np class Window(QMainWindow): def __init__(self): super().__init__() title = "Matplotlib Embeding In PyQt5" top = 400 left = 400 width = 900 height = 500 self.setWindowTitle(title) self.setGeometry(top, left, width, height) self.MyUI() def MyUI(self): canvas = Canvas(self, width=8, height=4) canvas.move(0,0) button = QPushButton("Click Me", self) button.move(100, 450) button2 = QPushButton("Click Me Two", self) button2.move(250, 450) class Canvas(FigureCanvas): def __init__(self, parent = None, width = 5, height = 5, dpi = 100): fig = Figure(figsize=(width, height), dpi=dpi) self.axes = fig.add_subplot(111) FigureCanvas.__init__(self, fig) self.setParent(parent) self.plot() def plot(self): x = np.array([50, 30,40]) labels = ["Apples", "Bananas", "Melons"] ax = self.figure.add_subplot(111) ax.pie(x, labels=labels) app = QApplication(sys.argv) window = Window() window.show() app.exec() |
So at the top we have imported the required libraries that we need, basically we need
PyQt5, Matplotlib and also Numpy.
|
1 2 3 4 5 |
from PyQt5.QtWidgets import QMainWindow, QApplication, QPushButton import sys from matplotlib.backends.backend_qt5agg import FigureCanvasQTAgg as FigureCanvas from matplotlib.figure import Figure import numpy as np |
OK this is our main window class that inherits from QMainWindow, and we have some
requirements of the window like title, width, height of the window, also we have called
our MyUI() method in this class.
|
1 2 3 4 5 6 7 8 9 10 11 12 13 14 |
class Window(QMainWindow): def __init__(self): super().__init__() title = "Matplotlib Embeding In PyQt5" top = 400 left = 400 width = 900 height = 500 self.setWindowTitle(title) self.setGeometry(top, left, width, height) self.MyUI() |
So in this method we have created a Canvas with two QPushButton.
|
1 2 3 4 5 6 7 8 9 10 |
def MyUI(self): canvas = Canvas(self, width=8, height=4) canvas.move(0,0) button = QPushButton("Click Me", self) button.move(100, 450) button2 = QPushButton("Click Me Two", self) button2.move(250, 450) |
And this is our Canvas class that inherits from FigureCanvas.
|
1 2 3 4 5 6 7 8 9 |
class Canvas(FigureCanvas): def __init__(self, parent = None, width = 5, height = 5, dpi = 100): fig = Figure(figsize=(width, height), dpi=dpi) self.axes = fig.add_subplot(111) FigureCanvas.__init__(self, fig) self.setParent(parent) self.plot() |
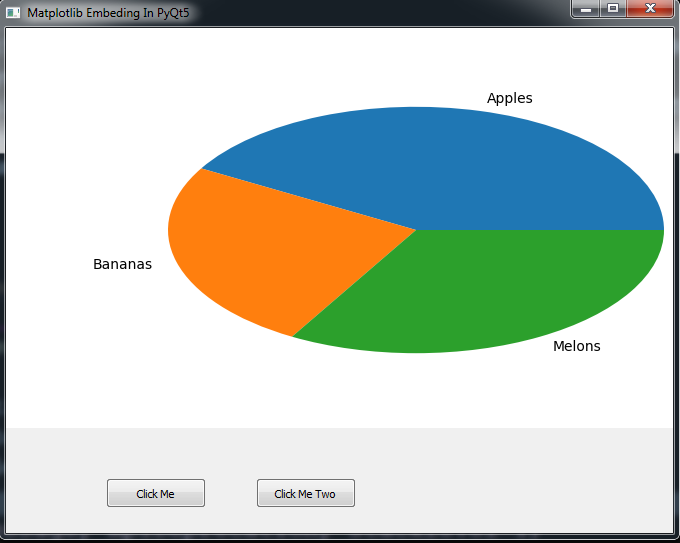
Also in here we are going to plot a pie chart in PyQt5 window.
|
1 2 3 4 5 |
def plot(self): x = np.array([50, 30,40]) labels = ["Apples", "Bananas", "Melons"] ax = self.figure.add_subplot(111) ax.pie(x, labels=labels) |
So in here every PyQt5 application must create an application object. The sys.argv
parameter is a list of arguments from a command line.
|
1 |
app = QApplication(sys.argv) |
Finally, we enter the mainloop of the application. The event handling starts from this point.
The mainloop receives events from the window system and dispatches them to the
application widgets.
|
1 2 |
app.exec() sys.exit() |
Run the complete code and this will be the result

Also you can watch the complete video for this article
Subscribe and Get Free Video Courses & Articles in your Email
¿ how to show de grafic when i click de button?
use function
pushButton.clicked.connect(“call your graph plotting function”)