In this Google Map Python article i want to show you How To Create Markers. basically we are
using gmaps library for creating of maps.
Check the previous article on Python Google Map
1: Python Google Map Introduction With gmaps
2: Python Google Map Customizing Width & Height
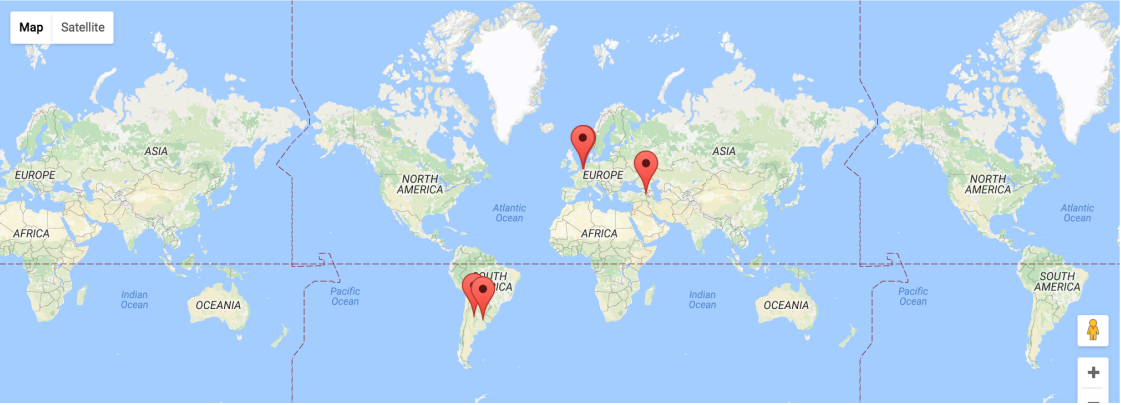
We can add a layer of markers to a Google map. Each marker represents an individual data point.
|
1 2 3 4 5 6 7 8 9 10 11 12 13 14 15 16 17 |
import gmaps gmaps.configure(api_key='AI...') marker_locations = [ (-34.0, -59.166672), (-32.23333, -64.433327), (40.166672, 44.133331), (51.216671, 5.0833302), (51.333328, 4.25) ] fig = gmaps.figure() markers = gmaps.marker_layer(marker_locations) fig.add_layer(markers) fig |
Run the complete code ad this will be the result.
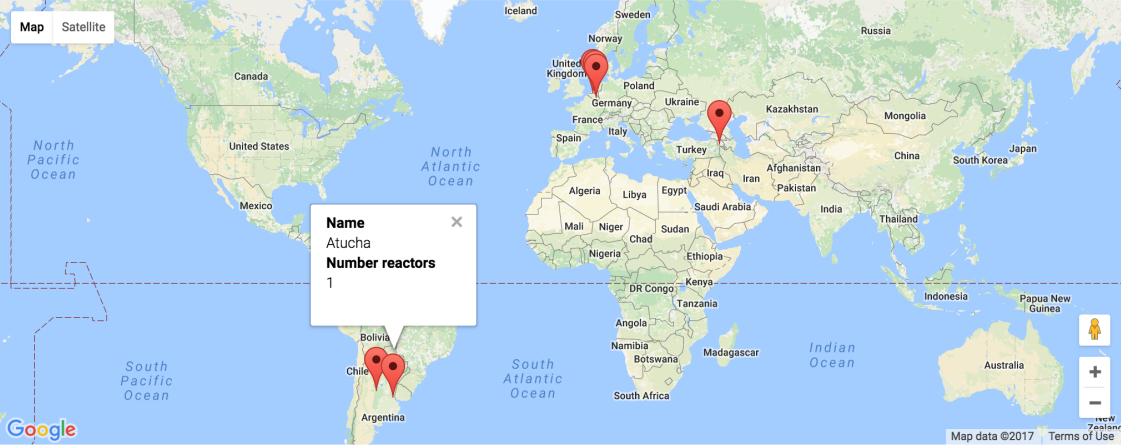
We can also attach a pop-up box to each marker. Clicking on the marker will bring up the info
box. The content of the box can be either plain text or html.
|
1 2 3 4 5 6 7 8 9 10 11 12 13 14 15 16 17 18 19 20 21 22 |
import gmaps gmaps.configure(api_key='AI...') nuclear_power_plants = [ {'name': 'Atucha', 'location': (-34.0, -59.167), 'active_reactors': 1}, {'name': 'Embalse', 'location': (-32.2333, -64.4333), 'active_reactors': 1}, {'name': 'Armenia', 'location': (40.167, 44.133), 'active_reactors': 1}, {'name': 'Br', 'location': (51.217, 5.083), 'active_reactors': 1}, {'name': 'Doel', 'location': (51.333, 4.25), 'active_reactors': 4}, {'name': 'Tihange', 'location': (50.517, 5.283), 'active_reactors': 3} ] plant_locations = [plant['location'] for plant in nuclear_power_plants] info_box_template = """ <dl> <dt>Name</dt><dd>{name}</dd> <dt>Number reactors</dt><dd>{active_reactors}</dd> </dl> """ plant_info = [info_box_template.format(**plant) for plant in nuclear_power_plants] marker_layer = gmaps.marker_layer(plant_locations, info_box_content=plant_info) fig = gmaps.figure() fig.add_layer(marker_layer) fig |
Run the complete code ad this will be the result.
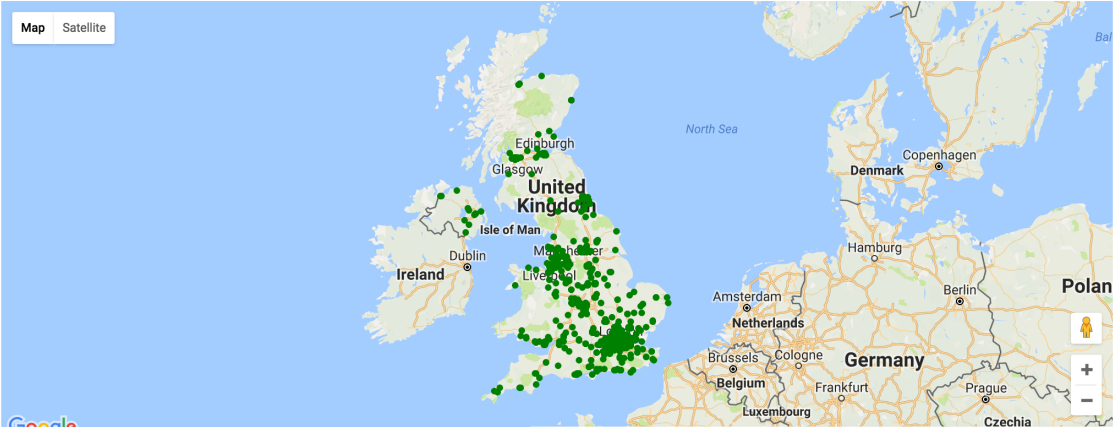
Markers are currently limited to the Google maps style drop icon. If you need to draw more complex
shape on maps, use the symbol_layer function. Symbols represent each latitude, longitude pair with
a circle whose color and size you can customize. Let’s, for instance, plot the location of every
Starbuck’s coffee shop in the UK.
|
1 2 3 4 5 6 7 8 9 10 11 12 13 14 |
import gmaps import gmaps.datasets gmaps.configure(api_key='AI..') df = gmaps.datasets.load_dataset_as_df('starbucks_kfc_uk') starbucks_df = df[df['chain_name'] == 'starbucks'] starbucks_df = starbucks_df[['latitude', 'longitude']] starbucks_layer = gmaps.symbol_layer( starbucks_df, fill_color='green', stroke_color='green', scale=2 ) fig = gmaps.figure() fig.add_layer(starbucks_layer) fig |
Run the complete code ad this will be the result.
Also you can watch the complete video for this article
Subscribe and Get Free Video Courses & Articles in your Email