In this Kivy tutorial we want to learn about Creating Charts and Graphs with Python Kivy, so Kivy is an open source Python library for creating multi touch applications and user interfaces. it provides different tools for building interactive applications, including the ability to create charts and graphs. in this article we want to cover how to use Kivy to create different types of charts and graphs.
Creating Charts and Graphs with Python Kivy
For creating charts and graphs in Kivy, first of all we need to install Kivy and you can use pip for that.
|
1 |
pip install kivy |
For creating basic chart with Kivy, we can use Kivy Garden Graph module. Garden is a collection of Kivy widgets and tools that can be installed separately. to install Garden Graph module run this command:
|
1 |
garden install graph |
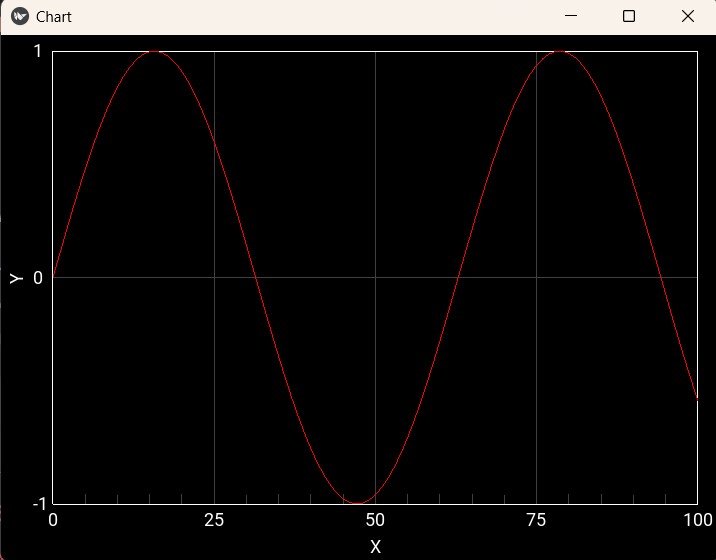
So now let’s create our basic charts or graphs using Kivy, this is simple code for a sin chart in Kivy.
|
1 2 3 4 5 6 7 8 9 10 11 12 13 14 15 16 17 18 19 20 21 22 23 24 25 26 27 28 29 |
from kivy.garden.graph import Graph, MeshLinePlot from kivy.app import App from kivy.uix.boxlayout import BoxLayout from math import sin class ChartApp(App): def build(self): # Create box layout layout = BoxLayout() # Create graph graph = Graph(xlabel='X', ylabel='Y', x_ticks_minor=5, x_ticks_major=25, y_ticks_major=1, y_grid_label=True, x_grid_label=True, padding=5, x_grid=True, y_grid=True, xmin=-0, xmax=100, ymin=-1, ymax=1) # Create plot plot = MeshLinePlot(color=[1, 0, 0, 1]) plot.points = [(x, sin(x / 10.)) for x in range(0, 101)] graph.add_plot(plot) # Add graph to the layout layout.add_widget(graph) return layout if __name__ == '__main__': ChartApp().run() |
In the above code we have imported the necessary modules. after that we creates BoxLayout widget, which will contain the graph. and than we creates a Graph widget which represents the graph. we set x and y labels, tick marks and grid lines for the graph.
After that we creates MeshLinePlot which represents plot line on the graph. we set color of the plot line and set the points attribute to list of (x, y) coordinates. in this example we have used sin function from the math module to generate y values for the plot. and lastly we add plot to the graph using add_plot method, after that we add the graph to the layout. we return the layout which is then displayed by the app.
Run the complete code and this will be the result
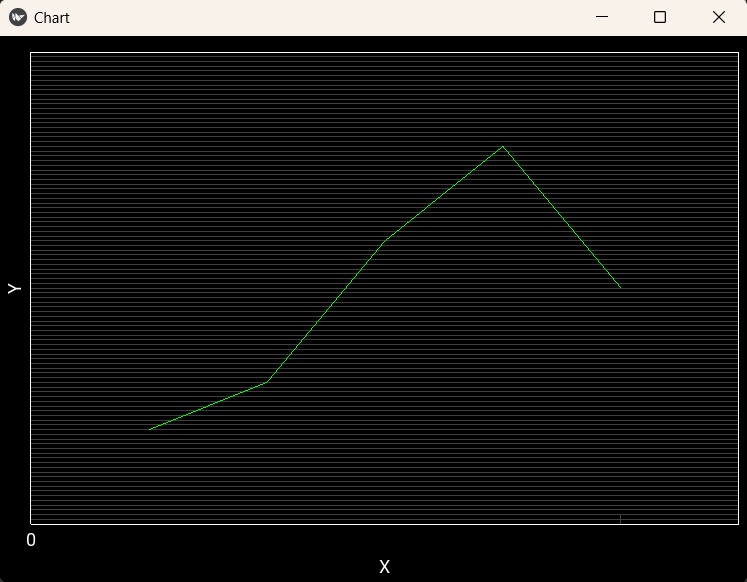
We can also create a bar chart with Kivy.
|
1 2 3 4 5 6 7 8 9 10 11 12 13 14 15 16 17 18 19 20 21 22 23 24 25 26 27 28 |
from kivy.garden.graph import Graph, MeshLinePlot from kivy.app import App from kivy.uix.boxlayout import BoxLayout class ChartApp(App): def build(self): # Create box layout layout = BoxLayout() # Create graph graph = Graph(xlabel='X', ylabel='Y', x_ticks_minor=5, x_ticks_major=25, y_ticks_major=1, y_grid_label=True, x_grid_label=True, padding=5, x_grid=True, y_grid=True, xmin=-0, xmax=6, ymin=0, ymax=100) # Create bar plot bar = MeshLinePlot(color=[0, 1, 0, 1]) bar.width = 0.8 bar.points = [(1, 20), (2, 30), (3, 60), (4, 80), (5, 50)] graph.add_plot(bar) # Add graph to the layout layout.add_widget(graph) return layout if __name__ == '__main__': ChartApp().run() |
Run the complete code and this will be the result
Subscribe and Get Free Video Courses & Articles in your Email